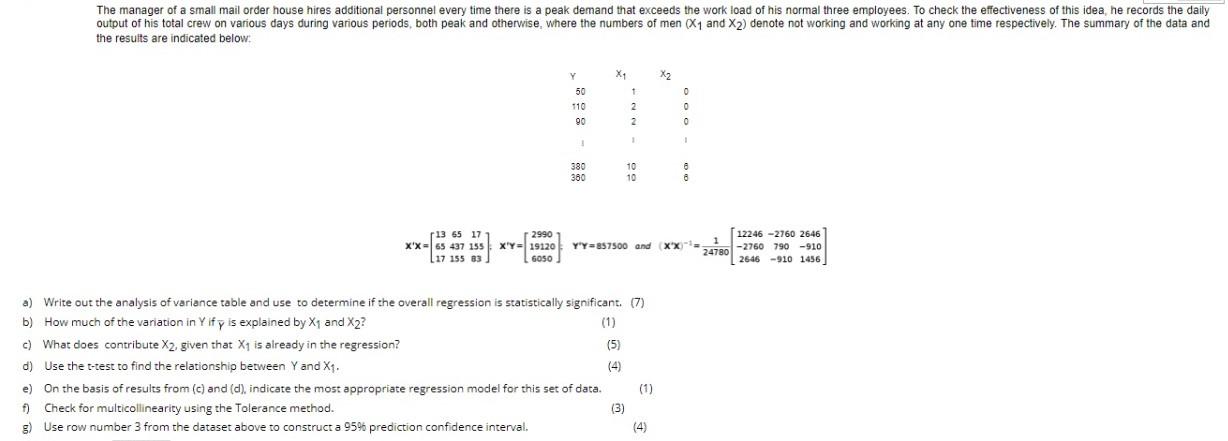
The manager of a small mail order house hires additional personnel every time there is a peak demand that exceeds the work load of his normal three employees. To check the effectiveness of this idea, he records the daily output of his total crew on various days during various periods, both peak and otherwise, where the numbers of men (X1 and X2) denote not working and working at any one time respectively. The summary of the data and the resuits are indicated below: Y X1 X2 50 1 0 110 2 0 90 2 0 1 380 380 10 10 2990 13 65 17 XX 65 437 155 117 155 83 X'Y=19120 Y'Y=357500 and 12246 -2760 2646 xx-.1 247801-2760 790 -910 -910 1456 GOSO 26:46 a) Write out the analysis of variance table and use to determine if the overall regression is statistically significant (7) b) How much of the variation in Yify is explained by X1 and X2? c) What does contribute X2, given that X1 is already in the regression? (5) d) Use the t-test to find the relationship between Y and X1. e) On the basis of results from (c) and (d), indicate the most appropriate regression model for this set of data. (1) (3) ) Check for multicollinearity using the Tolerance method. 8) Use row number 3 from the dataset above to construct a 95% prediction confidence interval. (4) The manager of a small mail order house hires additional personnel every time there is a peak demand that exceeds the work load of his normal three employees. To check the effectiveness of this idea, he records the daily output of his total crew on various days during various periods, both peak and otherwise, where the numbers of men (X1 and X2) denote not working and working at any one time respectively. The summary of the data and the resuits are indicated below: Y X1 X2 50 1 0 110 2 0 90 2 0 1 380 380 10 10 2990 13 65 17 XX 65 437 155 117 155 83 X'Y=19120 Y'Y=357500 and 12246 -2760 2646 xx-.1 247801-2760 790 -910 -910 1456 GOSO 26:46 a) Write out the analysis of variance table and use to determine if the overall regression is statistically significant (7) b) How much of the variation in Yify is explained by X1 and X2? c) What does contribute X2, given that X1 is already in the regression? (5) d) Use the t-test to find the relationship between Y and X1. e) On the basis of results from (c) and (d), indicate the most appropriate regression model for this set of data. (1) (3) ) Check for multicollinearity using the Tolerance method. 8) Use row number 3 from the dataset above to construct a 95% prediction confidence interval. (4)


