Answered step by step
Verified Expert Solution
Question
1 Approved Answer
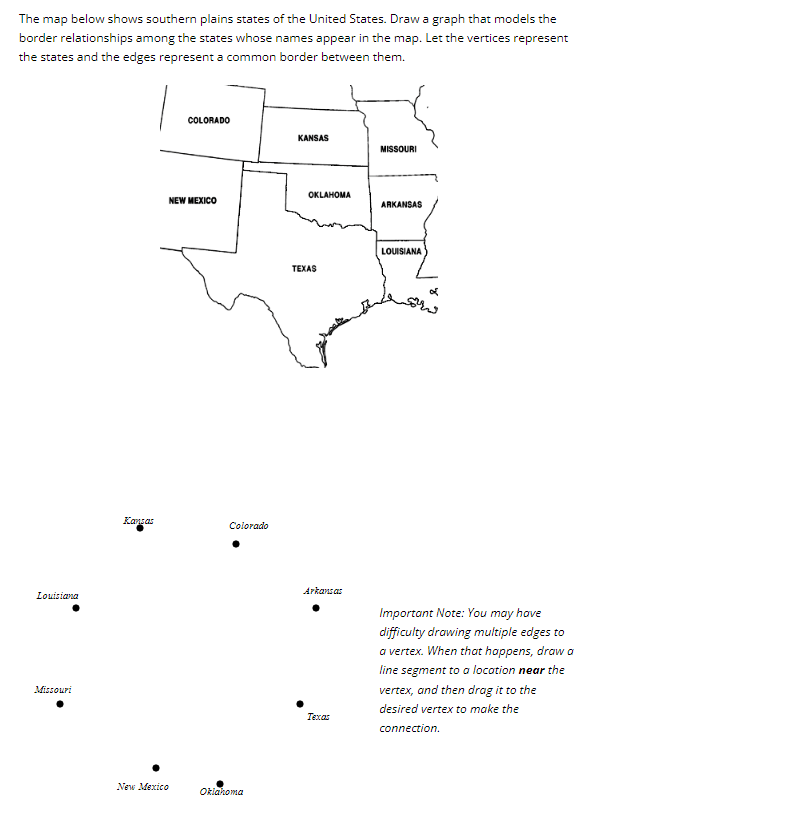
The map below shows southern plains states of the United States. Draw a graph that models the border relationships among the states whose names appear
The map below shows southern plains states of the United States. Draw a graph that models the
border relationships among the states whose names appear in the map. Let the vertices represent
the states and the edges represent a common border between them.
Ransas
Louisiana
Missouri
Colorado
Aphansas
Important Note: You may have
difficulty drawing multiple edges to
a vertex. When that happens, draw a
line segment to a location near the
vertex, and then drag it to the
desired vertex to make the
connection.

Step by Step Solution
There are 3 Steps involved in it
Step: 1

Get Instant Access to Expert-Tailored Solutions
See step-by-step solutions with expert insights and AI powered tools for academic success
Step: 2

Step: 3

Ace Your Homework with AI
Get the answers you need in no time with our AI-driven, step-by-step assistance
Get Started


