

Answered step by step
Verified Expert Solution
Question
1 Approved Answer
The market portfolio ( M ) provides a 1 5 % annual return with a 2 0 % standard deviation. The risk - free rate
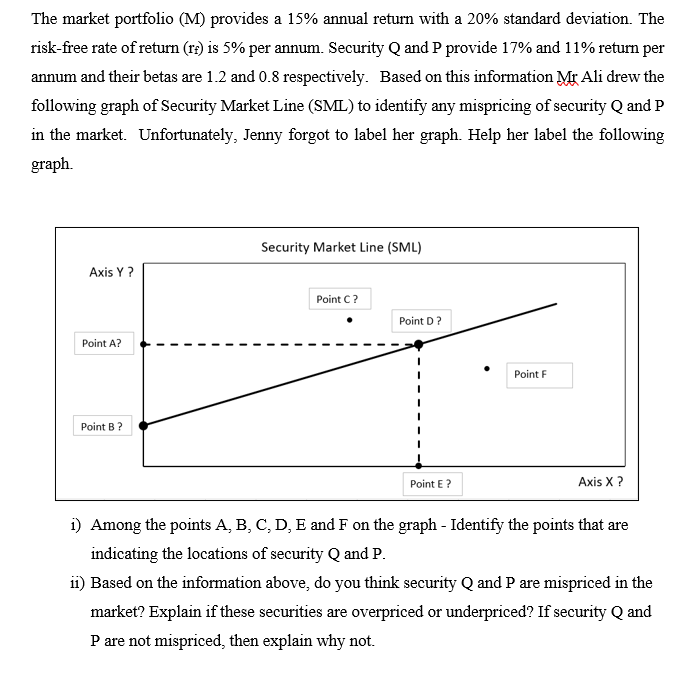
The market portfolio provides a annual return with a standard deviation. The riskfree rate of return is per annum. Security and provide and return per annum and their betas are and respectively. Based on this information Mr Ali drew the following graph of Security Market Line SML to identify any mispricing of security and in the market. Unfortunately, Jenny forgot to label her graph. Help her label the following graph.
i Identify the labels for Axis and Axis
ii Among the points, A B C D E and F on the graph identify the locations of riskfree return and market portfolio M
Step by Step Solution
There are 3 Steps involved in it
Step: 1

Get Instant Access to Expert-Tailored Solutions
See step-by-step solutions with expert insights and AI powered tools for academic success
Step: 2

Step: 3
Ace Your Homework with AI
Get the answers you need in no time with our AI-driven, step-by-step assistance
Get Started
Handbook Of The Economics Of Finance Corporate Finance Volume 1A
Authors: George M. Constantinides, M. Harris, Rene M. Stulz
1st Edition
0444513620, 978-0444513625