

Question
The mean unemployment rate in January of each year from 1995 to 2004 is x? = 5.06, with a standard deviation of sx= 1.2. The
The mean unemployment rate in January of each year from 1995 to 2004 is x? = 5.06, with a standard deviation of sx= 1.2. The mean unemployment rate in June of each year for the same time frame is y? = 5.09, with a standard deviation of sy= 0.9. The correlation coefficient is r = 0.89.
Part A: Find the equation of the least-squares regression line for predicting June's unemployment rate from January's unemployment rate. Show your work. (3 points)
Part B: Use the regression line to predict the unemployment rate if January's rate is 4.3. Show your work. (3 points)
Part C: Find and interpret r-squared. (4 points)
ALSO ANSWER THIS ONE PLEASE!
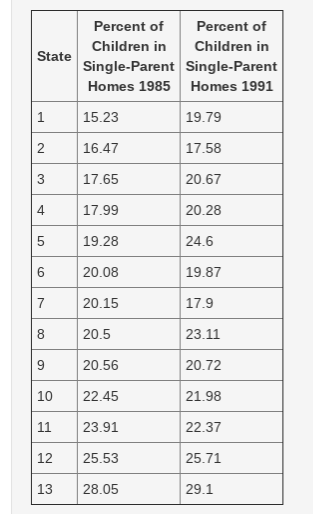
The percentage of children ages 1 to 14 living in a single-parent home in 1985 compared to 1991 for 13 states was gathered.
Step by Step Solution
There are 3 Steps involved in it
Step: 1

Get Instant Access to Expert-Tailored Solutions
See step-by-step solutions with expert insights and AI powered tools for academic success
Step: 2

Step: 3
Ace Your Homework with AI
Get the answers you need in no time with our AI-driven, step-by-step assistance
Get Started
Mcdougal Littell High School Math Algebra 1 2012
Authors: Ron Larson, Laurie Boswell, Timothy D. Kanold, Lee Stiff
1st Edition
9780547476841, 0547476841