

Answered step by step
Verified Expert Solution
Question
1 Approved Answer
The Minitab output shown below was obtained by using paired data consisting of weights (in lb) of 32 cars and their highway fuel consumption amounts
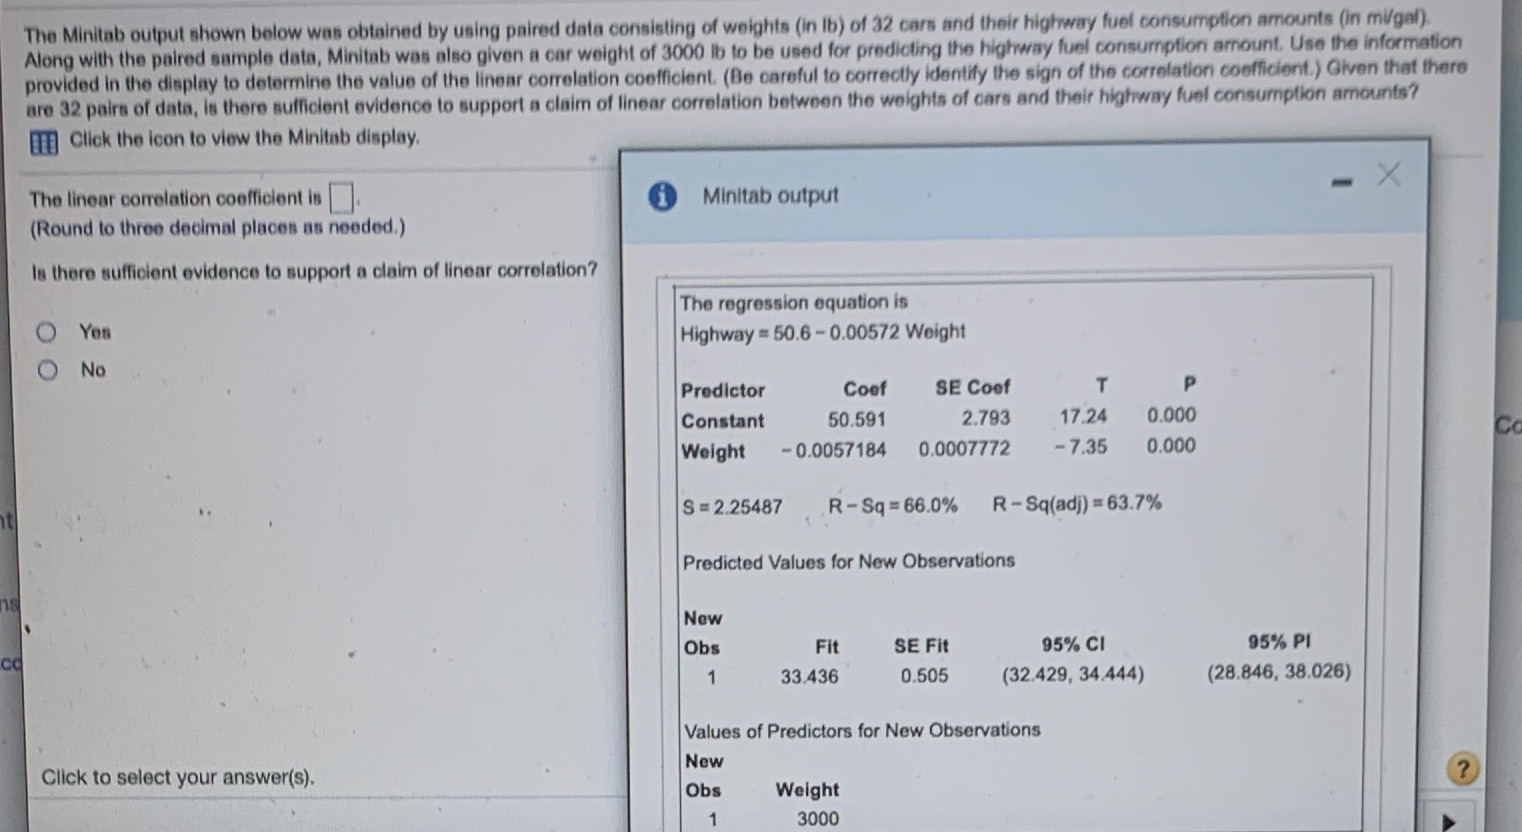 The Minitab output shown below was obtained by using paired data consisting of weights (in lb) of 32 cars and their highway fuel consumption amounts (in mi/gal). Along with the paired sample data, Minitab was also given a car weight of 3000 lb to be used for predicting the highway fuel consumption amount. Use the information provided in the display to determine the value of the linear correlation coefficient. (Be careful to correctly identify the sign of the correlation coefficient.) Given that there are 32 pairs of data, is there sufficient evidence to support a claim of linear correlation between the weights of cars and their highway fuel consumption amounts? If Click the icon to view the Minitab display. The linear correlation coefficient is. Minitab output - X (Round to three decimal places as needed.) Is there sufficient evidence to support a claim of linear correlation? The regression equation is O You Highway = 50.6 - 0.00572 Weight No Predictor Coof SE Coof T P Constant 50.591 2.793 17.24 0.000 Co Weight - 0.0057184 0.0007772 -7.35 0.000 S = 2.25487 R - Sq = 66.0% R -Sq(adj) = 63.7% Predicted Values for New Observations New CC Obs Fit SE Fit 95% CI 95% PI 1 33.436 0.505 (32.429, 34.444) (28.846, 38.026) Values of Predictors for New Observations Click to select your answer(s). New Obs Weight 3000
Step by Step Solution
There are 3 Steps involved in it
Step: 1

Get Instant Access to Expert-Tailored Solutions
See step-by-step solutions with expert insights and AI powered tools for academic success
Step: 2

Step: 3
Ace Your Homework with AI
Get the answers you need in no time with our AI-driven, step-by-step assistance
Get Started
High School Math 2012 Common-core Algebra 2 Grade 10/11
Authors: Savvas Learning Co
Student Edition
9780133186024, 0133186024