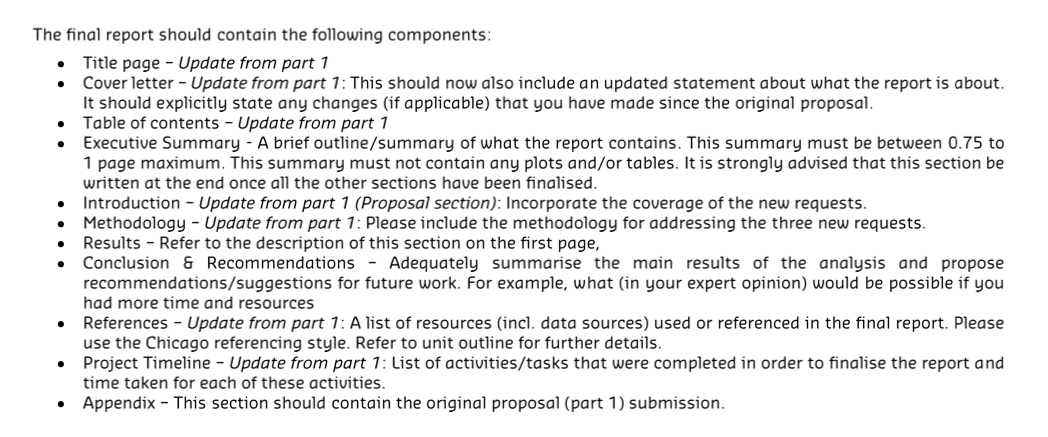
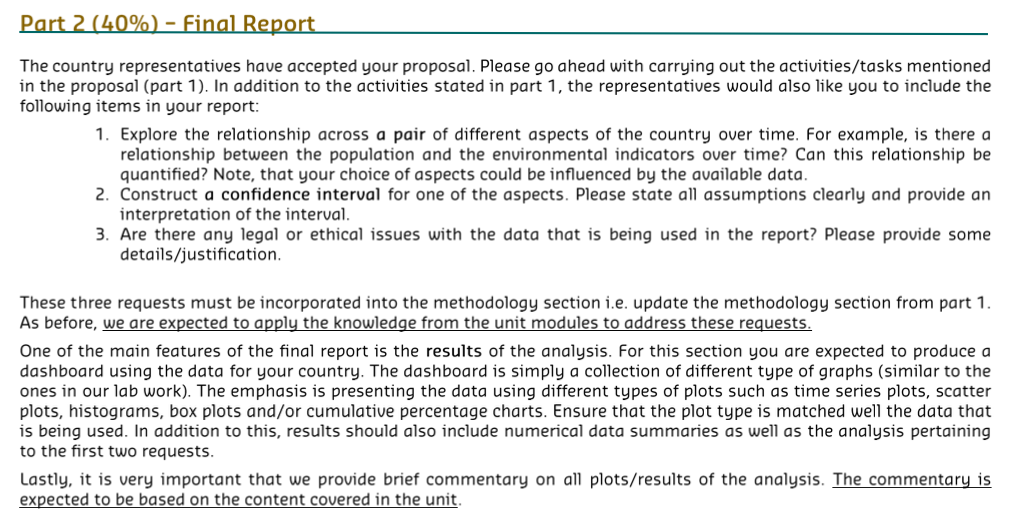
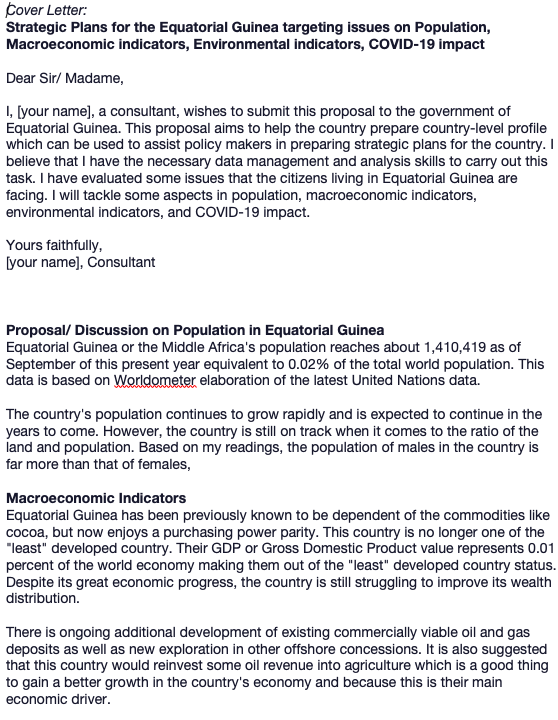
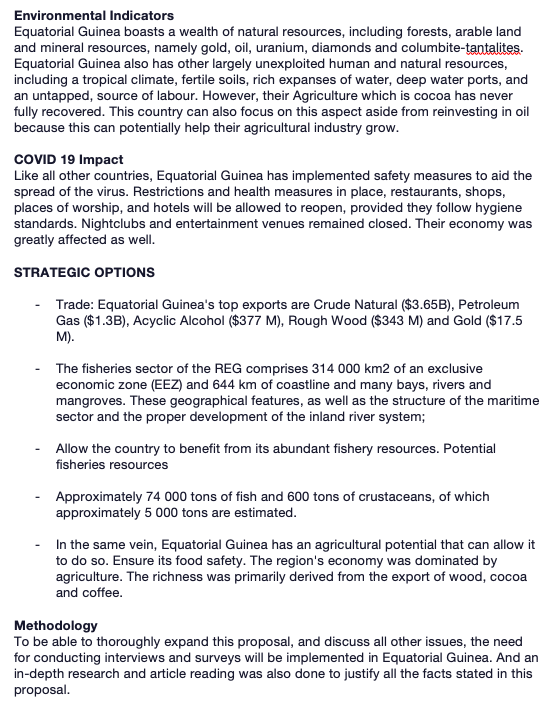
The nal report should contain the followi ng components: Title page - Update from part 1 Coverletter - Update from part 1: This should now also include an updated statement about what the report is about. It should explicitly state any changes [if applicable) that you have made since the original proposal. Table of contents Update from part 1 Executive Summary ~ A brief outline/summary of what the report contains. This summary must be between 0.75 to 1 page maximum. This summary must not contain any plots and/or tables. It is strongly advised that this section be written at the end once all the other sections have been finalised. Introduction - Update from part 1 {Proposal section): Incorporate the coverage of the new requests. Methodology - Update from part 1: Please include the methodology for addressing the three new requests. Results - Refer to the description of this section on the first page, Conclusion 6 Recommendations - Adeq uately summarise the main results of the analysis and propose recommendations/suggestions for future work. For example, what {in your expert opinion} would be possible if you had more time and resources References Update from part 1: A list of resources (incl. data sources] used or referenced in the final report. Please use the Chicago referencing style. Refer to unit outline for further details. Project Timeline - Update from part 1: List of activities/tasks that were completed in order to nalise the report and time taken for each of these activities. Appendix - This section should contain the original proposal (part \"I ) submission. W The country representatives have accepted your proposal. Please go ahead with carrying out the activities/tasks mentioned in the proposal (part 1]. In addition to the activities stated in part \"I , the representatives would also like you to include the following items in your report: 1. Explore the relationship across a pair of different aspects of the country over time. For example. is there a relationship between the population and the environmental indicators over time? Can this relationship be quantified? Note, that your choice of aspects could be influenced by the available data. 2. Canstruct a condence interval for one of the aspects. Please state all assumptions clearly and provide an interpretation of the interval. 3. Are there any legal or ethical issues with the data that is being used in the report? Please provide some details/justification. These three requests must be incorporated into the methodology section i.e. update the methodology section from part 'I. As before, we are expected to apply the knowledge from the unit modules to address these requests. One of the main features of the final report is the results of the analysis. For this section you are expected to produce a dashboard using the data for your country. The dashboard is simply a collection of different type of graphs [similar to the ones in our lab work). The emphasis is presenting the data using different types of plots such as time series plots. scatter plots, histograms, box plots and/or cumulative percentage charts. Ensure that the plot type is matched well the data that is being used. In addition to this, results should also include numerical data summaries as well as the analysis pertaining to the first two requests. Lastly, it is very important that we provide brief commentary on all plots/results of the analysis. The commentary is expected to be based on the content covered in the unit. Cover Letter: Strategic Plans for the Equatorial Guinea targeting issues on Population, Macroeconomic indicators, Environmental indicators, COVID-19 impact Dear Sir/ Madame, I, [your name], a consultant, wishes to submit this proposal to the government of Equatorial Guinea. This proposal aims to help the country prepare country-level profile which can be used to assist policy makers in preparing strategic plans for the country. I believe that I have the necessary data management and analysis skills to carry out this task. I have evaluated some issues that the citizens living in Equatorial Guinea are facing. I will tackle some aspects in population, macroeconomic indicators, environmental indicators, and COVID-19 impact. Yours faithfully, your name], Consultant Proposal/ Discussion on Population in Equatorial Guinea Equatorial Guinea or the Middle Africa's population reaches about 1,410,419 as of September of this present year equivalent to 0.02% of the total world population. This data is based on Worldometer elaboration of the latest United Nations data. The country's population continues to grow rapidly and is expected to continue in the years to come. However, the country is still on track when it comes to the ratio of the land and population. Based on my readings, the population of males in the country is far more than that of females, Macroeconomic Indicators Equatorial Guinea has been previously known to be dependent of the commodities like cocoa, but now enjoys a purchasing power parity. This country is no longer one of the "least" developed country. Their GDP or Gross Domestic Product value represents 0.01 percent of the world economy making them out of the "least" developed country status. Despite its great economic progress, the country is still struggling to improve its wealth distribution. There is ongoing additional development of existing commercially viable oil and gas deposits as well as new exploration in other offshore concessions. It is also suggested that this country would reinvest some oil revenue into agriculture which is a good thing to gain a better growth in the country's economy and because this is their main economic driver.Environmental Indicators Equatorial Guinea boasts a wealth of natural resources, including forests, arable land and mineral resources, namely gold, oil, uranium, diamonds and columbite-tantalites. Equatorial Guinea also has other largely unexploited human and natural resources, including a tropical climate, fertile soils, rich expanses of water, deep water ports, and an untapped, source of labour. However, their Agriculture which is cocoa has never fully recovered. This country can also focus on this aspect aside from reinvesting in oil because this can potentially help their agricultural industry grow. COVID 19 Impact Like all other countries, Equatorial Guinea has implemented safety measures to aid the spread of the virus. Restrictions and health measures in place, restaurants, shops, places of worship, and hotels will be allowed to reopen, provided they follow hygiene standards. Nightclubs and entertainment venues remained closed. Their economy was greatly affected as well. STRATEGIC OPTIONS Trade: Equatorial Guinea's top exports are Crude Natural ($3.65B), Petroleum Gas ($1.3B), Acyclic Alcohol ($377 M), Rough Wood ($343 M) and Gold ($17.5 M). The fisheries sector of the REG comprises 314 000 km2 of an exclusive economic zone (EEZ) and 644 km of coastline and many bays, rivers and mangroves. These geographical features, as well as the structure of the maritime sector and the proper development of the inland river system; Allow the country to benefit from its abundant fishery resources. Potential fisheries resources Approximately 74 000 tons of fish and 600 tons of crustaceans, of which approximately 5 000 tons are estimated. In the same vein, Equatorial Guinea has an agricultural potential that can allow it to do so. Ensure its food safety. The region's economy was dominated by agriculture. The richness was primarily derived from the export of wood, cocoa and coffee. Methodology To be able to thoroughly expand this proposal, and discuss all other issues, the need for conducting interviews and surveys will be implemented in Equatorial Guinea. And an in-depth research and article reading was also done to justify all the facts stated in this proposal


