

Answered step by step
Verified Expert Solution
Question
1 Approved Answer
The objective of this assignment is to demonstrate proficiency in creating an Excel dashboard that utilizes pivot tables, advanced formulas, and data visualization techniques. Additionally,
The objective of this assignment is to demonstrate proficiency in creating an Excel dashboard that utilizes pivot tables, advanced formulas, and data visualization techniques. Additionally, students are required to write a descriptive report that interprets the data and communicates insights derived from the dashboard.For your descriptive report dataset, your sales price per unit for all your product categories is $ Dataset: You will be provided with a sample dataset containing sales data for a fictional retail company. The dataset will include information such as sales transactions, product categories, dates, and sales revenue. In this dataset:
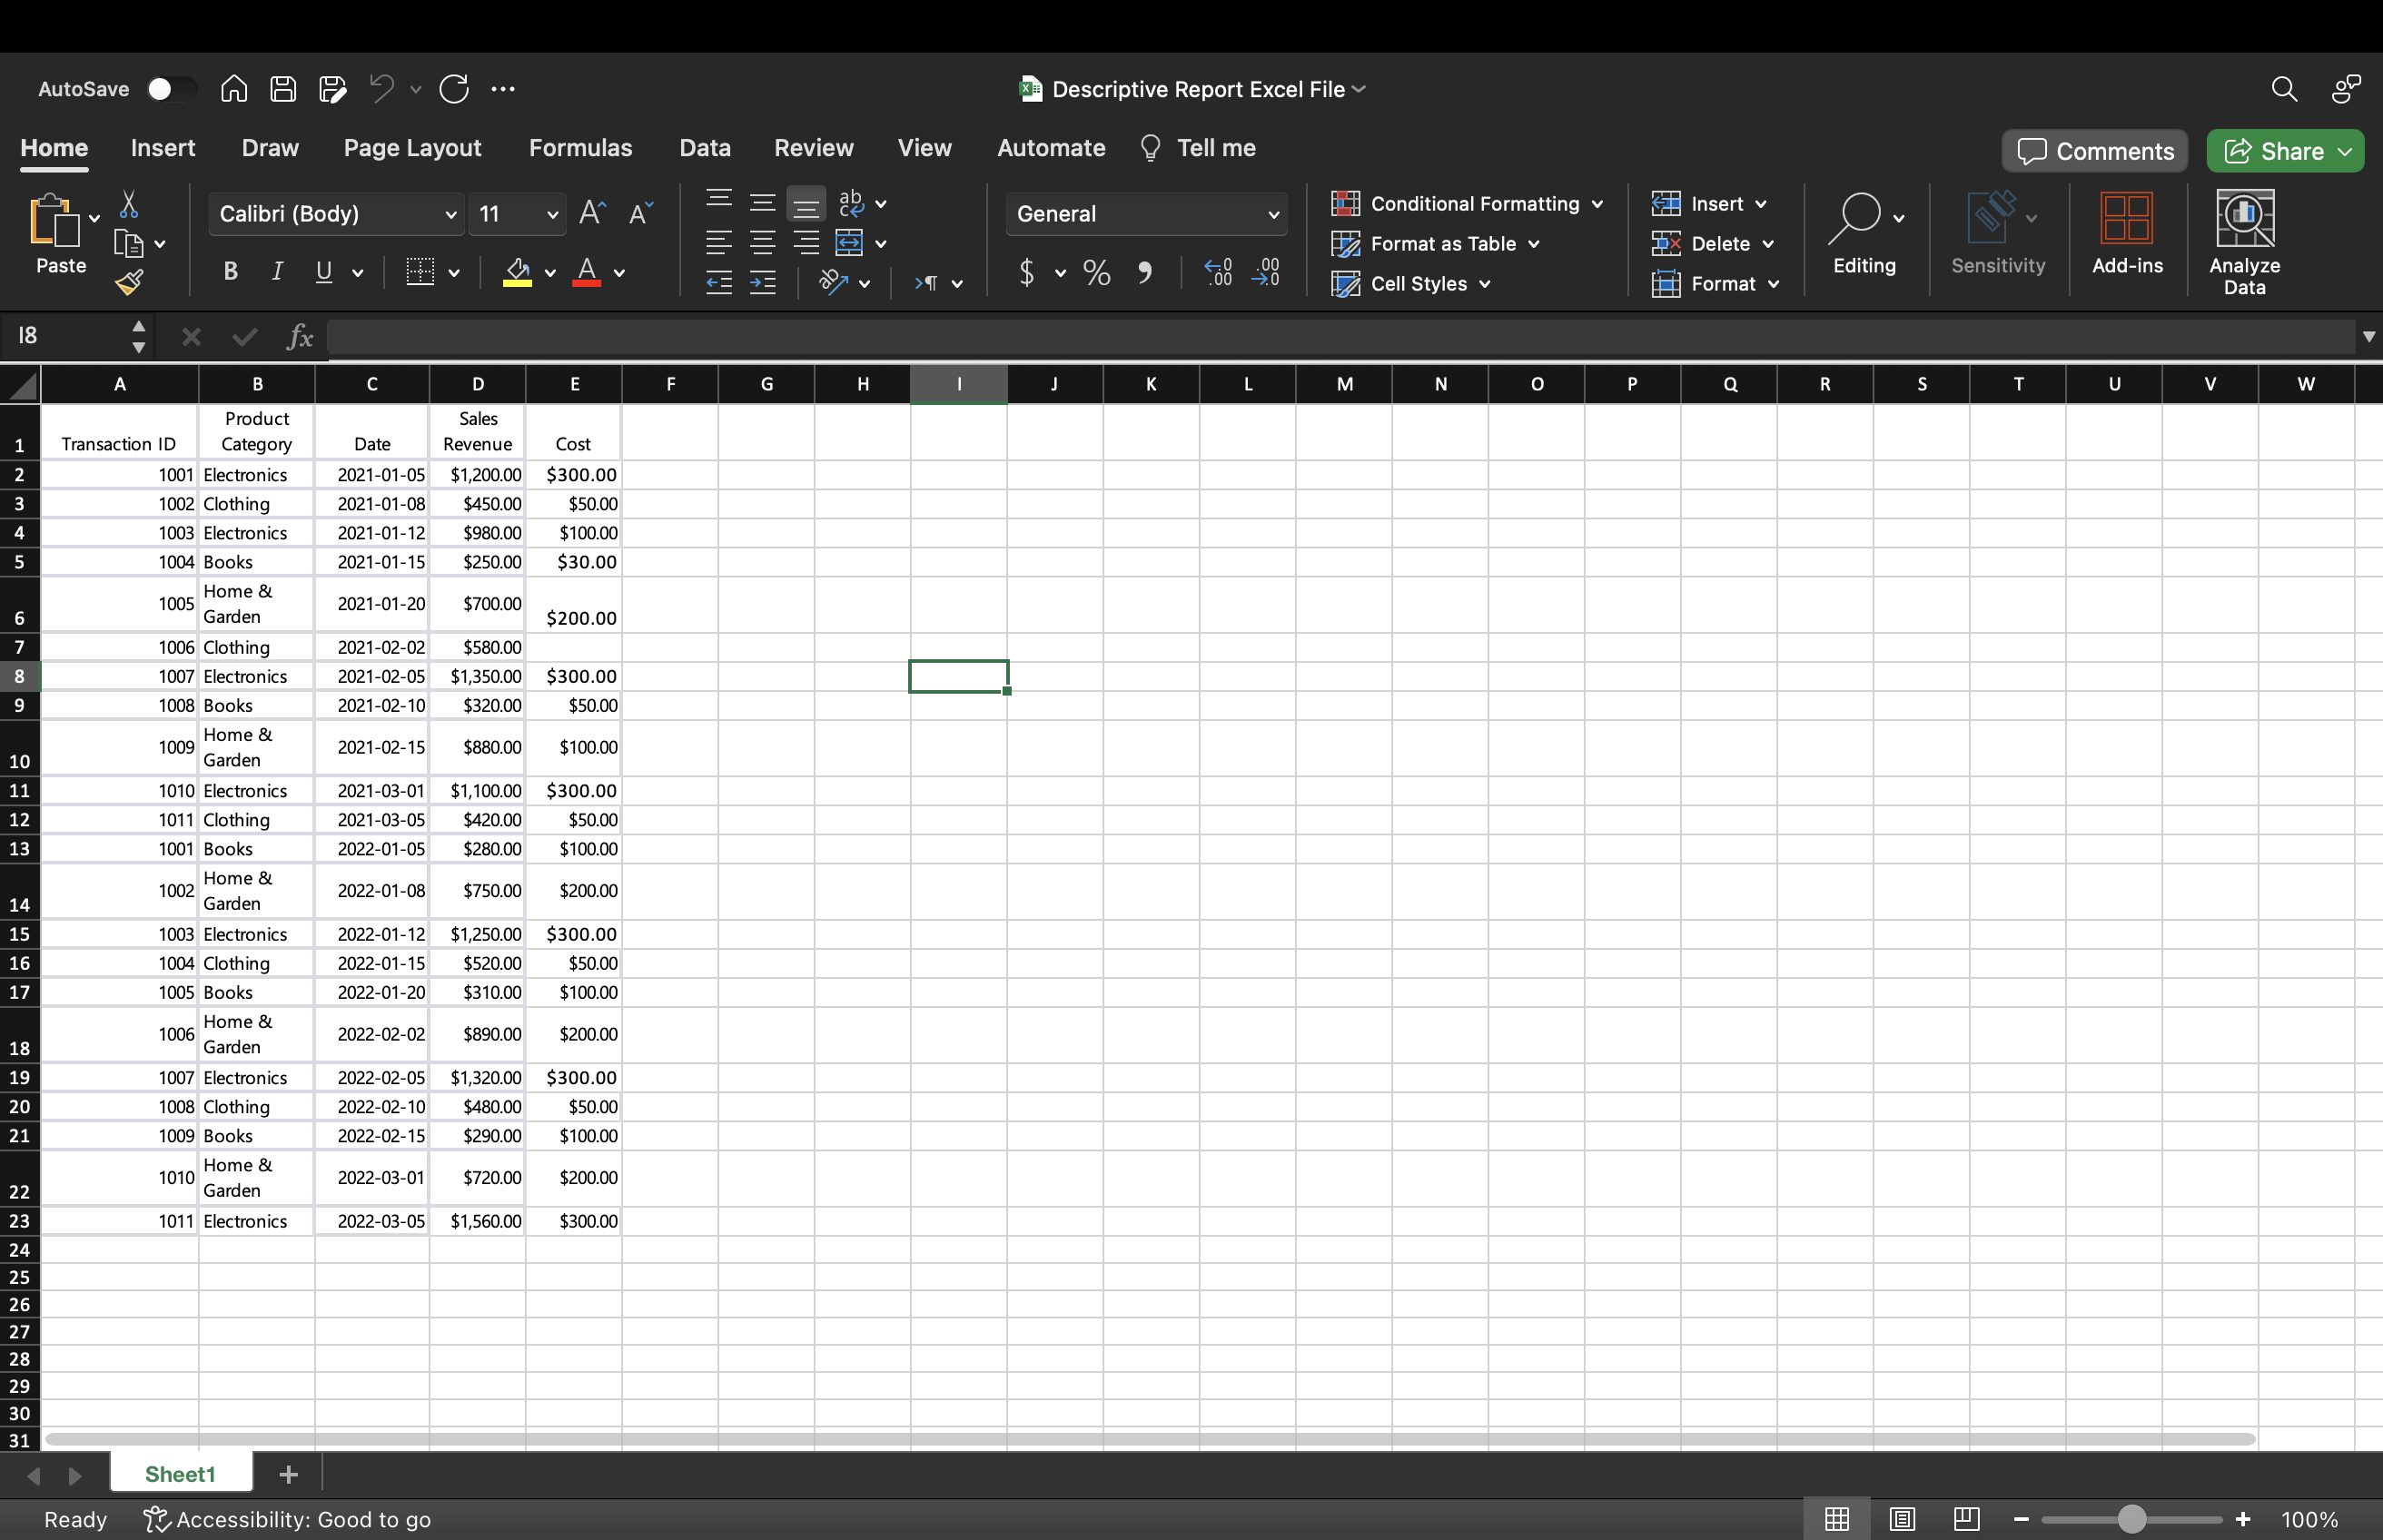
"Transaction ID represents a unique identifier for each sales transaction.
"Product Category" denotes the category to which the product belongs.
"Date" indicates the date of the sales transaction.
"Sales Revenue" represents the revenue generated from each transaction.
Requirements:
Import the provided dataset into Excel.
Create a pivot table that summarizes sales data by product category and month. Include columns for total sales revenue and the number of transactions.
Design a userfriendly dashboard using Excel features like slicers, charts, and tables.
Include the following elements in your dashboard:
A slicer to filter data by year.
A pivot chart eg bar chart or line chart that visualizes monthly sales trends by product category for the selected year.
A pivot table that displays the topselling products for the selected year, including product names, sales revenue, and units sold.
A calculated field that calculates the average transaction value sales revenue divided by the number of transactions for each product category.
Ensure that the dashboard is wellorganized, visually appealing, and easy to navigate.
can you creat excel dashboard with Descriptive Report to me
Step by Step Solution
There are 3 Steps involved in it
Step: 1

Get Instant Access to Expert-Tailored Solutions
See step-by-step solutions with expert insights and AI powered tools for academic success
Step: 2

Step: 3
Ace Your Homework with AI
Get the answers you need in no time with our AI-driven, step-by-step assistance
Get Started
Spatial Database Systems Design Implementation And Project Management
Authors: Albert K.W. Yeung, G. Brent Hall
1st Edition
1402053932, 978-1402053931