Answered step by step
Verified Expert Solution
Question
1 Approved Answer
The per capita consumption of commercially produced fresh vegetables in a certain country from 1980 through 2000 was as shown in the accompanying table. Per
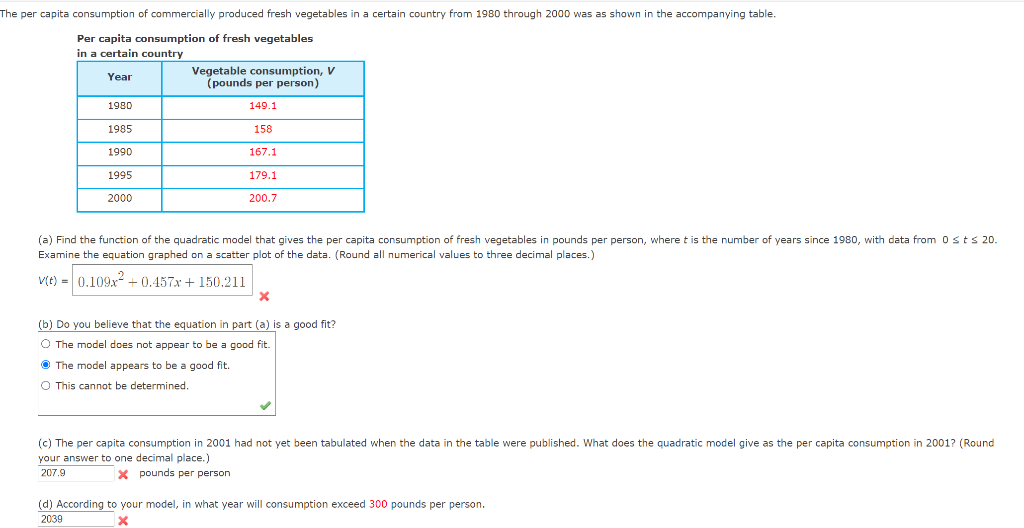
The per capita consumption of commercially produced fresh vegetables in a certain country from 1980 through 2000 was as shown in the accompanying table. Per capita consumption of fresh vegetables in a certain country Vegetable consumption, V Year (pounds per person) 1980 149.1 1985 158 1990 167.1 1995 179.1 2000 200.7 (a) Find the function of the quadratic model that gives the per capita consumption of fresh vegetables in pounds per person, where t is the number of years since 1980, with data from Osts 20. Examine the equation graphed on a scatter plot of the data. (Round all numerical values to three decimal places.) V(t) = 0.109x2 +0.457x + 150.211 (b) Do you believe that the equation in part (a) is a good fit? The model does not appear to be a good fit The model appears to be a good fit This cannot be determined. (c) The per capita consumption in 2001 had not yet been tabulated when the data in the table were published. What does the quadratic model give as the per capita consumption in 2001? (Round your answer to one decimal place.) 207.9 X pounds per person (d) According to your model, in what year will consumption exceed 300 pounds per person. X 2039
Step by Step Solution
There are 3 Steps involved in it
Step: 1
Get Instant Access to Expert-Tailored Solutions
See step-by-step solutions with expert insights and AI powered tools for academic success
Step: 2
Step: 3
Ace Your Homework with AI
Get the answers you need in no time with our AI-driven, step-by-step assistance
Get Started