

Question
The photo refers to the annual returns for two mutual funds offered by the investment giant Fidelity for the years 2001-2017. The Fidelity Select Automotive
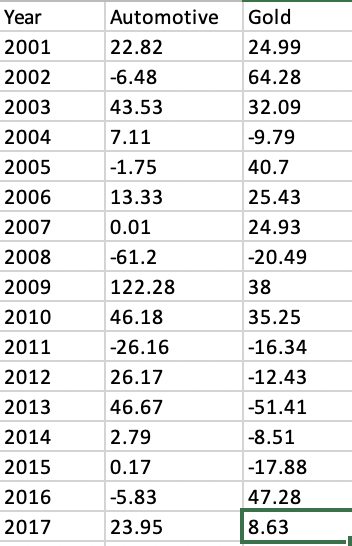
The photo refers to the annual returns for two mutual funds offered by the investment giant Fidelity for the years 2001-2017. The Fidelity Select Automotive mutual fund invests primarily in companies engaged in the manufacturing. Use the sample information to:
- Determine the mean averages of the data provided.
- Calculate the descriptive statistics to compare the returns of the mutual funds.
- Asses the rewards by constructing and interpreting 95% confidence intervals for the population mean return. What assumptions did you make when constructing the confidence intervals?
Supply the data and explain the results found from the above questions
Step by Step Solution
There are 3 Steps involved in it
Step: 1

Get Instant Access to Expert-Tailored Solutions
See step-by-step solutions with expert insights and AI powered tools for academic success
Step: 2

Step: 3
Ace Your Homework with AI
Get the answers you need in no time with our AI-driven, step-by-step assistance
Get Started
Precalculus Enhanced With Graphing Utilities (Subscription)
Authors: Michael, Michael Sullivan III, Michael III Sullivan, III Sullivan
6th Edition
0321849108, 9780321849106