Answered step by step
Verified Expert Solution
Question
1 Approved Answer
The price of a gallon of gasoline found at Florida gas stations in August of 2019 followed a normal distribution with a mean of


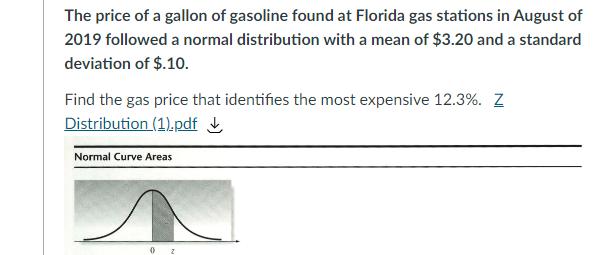
The price of a gallon of gasoline found at Florida gas stations in August of 2019 followed a normal distribution with a mean of $3.20 and a standard deviation of $.10. Find the gas price that identifies the most expensive 12.3%. Z Distribution (1).pdf Normal Curve Areas 02 Z .0 .1 .2 .3 4 .6 .7 .8 9 1.0 1.1 1.2 1.3 1.4 1.5 1.6 1.7 1.8 1.9 2.0 2.1 2.2 2.3 2.4 2.5 2.6 2.7 .00 .0000 .0398 .0793 1179 1554 .1915 2.8 2.9 3.0 .2257 2580 2881 .3159 3413 .3643 3849 .4032 .4192 .4332 .4452 4554 .4641 .4713 .4772 4821 .4861 .4893 .4918 .4938 .01 .0040 .0438 0832 .1217 .1591 .1950 .2291 .2611 2910 .3186 .3438 .3665 .3869 .4049 4207 4345 .4463 4564 .4649 4719 4778 .4826 .4864 4896 .4920 .4940 .02 .0080 .0478 .0871 .1255 .1628 .1985 2324 2642 2939 .3212 .3461 .3686 3888 .4066 4222 4357 .4474 .4573 .4656 .4726 .4783 .4830 .4868 .4898 .4922 .4941 .03 .0120 .0517 .0910 .1293 1664 2019 2357 2673 .2967 .3238 .3485 .3708 .3907 .4082 .4236 4370 .4484 4582 .4664 4732 4788 .4834 4871 4901 .4925 .4943 4957 .4968 .4977 .04 .0160 .0557 .0948 .1331 .1700 2054 2389 2704 .2995 .3264 .3508 3729 .3925 .4099 4251 4382 4495 4591 .4671 4738 4793 4838 4875 .4904 .4927 .4945 .05 .0199 .0596 .0987 .1368 1736 2088 .2422 2734 3023 .3289 .3531 .3749 .3944 4115 4265 4394 4505 4599 .4678 4744 4798 4842 4878 .4906 .4929 .4946 .06 .0239 .0636 .1026 .1406 1772 .2123 2454 2764 .3051 .3315 3554 .3770 .3962 4131 .4279 4406 .4515 .4608 .4686 .4750 4803 .4846 .4881 .4909 4931 .4948 .07 .0279 0675 .1064 .1443 .1808 2157 .2486 .2794 .3078 3340 .3577 .3790 3980 4147 .4292 4418 4525 .4616 .4693 .4756 4808 .4850 4884 .4911 4932 .4949 4962 .4972 4979 .4985 .4989 .08 .0319 0714 .1103 1480 .1844 2190 2517 .2823 .3106 .3365 .3599 3810 .3997 .4162 .4306 .4429 .4535 4625 .4699 4761 4812 .4854 4887 .4913 4934 .4951 .4963 .4973 4980 .09 .0359 .0753 1141 4986 .4990 1517 1879 .2224 2549 2852 .3133 3389 .3621 3830 4015 4177 4319 4441 4545 4633 .4706 4767 .4817 .4857 4890 4916 .4936 4952 .4953 .4955 .4956 .4959 .4960 .4961 .4965 .4966 .4967 .4969 .4970 .4971 .4974 .4975 .4976 .4977 4978 4979 .4981 .4982 .4982 .4983 .4984 .4984 .4985 4987 4987 4987 4988 .4988 .4989 .4989 Source: Abridged from Table 1 of A. Hald, Statistical Tables and Formulas (New York: Wiley), 1952. Reproduced by permission of A. Hald. .4964 4974 4981 .4986 .4990 $3.215 $3.238 $3.084 $3.316
Step by Step Solution
★★★★★
3.43 Rating (143 Votes )
There are 3 Steps involved in it
Step: 1
Step 12 Answer Given data The mean 320 and the standard deviation o 010 Ex...
Get Instant Access to Expert-Tailored Solutions
See step-by-step solutions with expert insights and AI powered tools for academic success
Step: 2

Step: 3

Ace Your Homework with AI
Get the answers you need in no time with our AI-driven, step-by-step assistance
Get Started


