Question
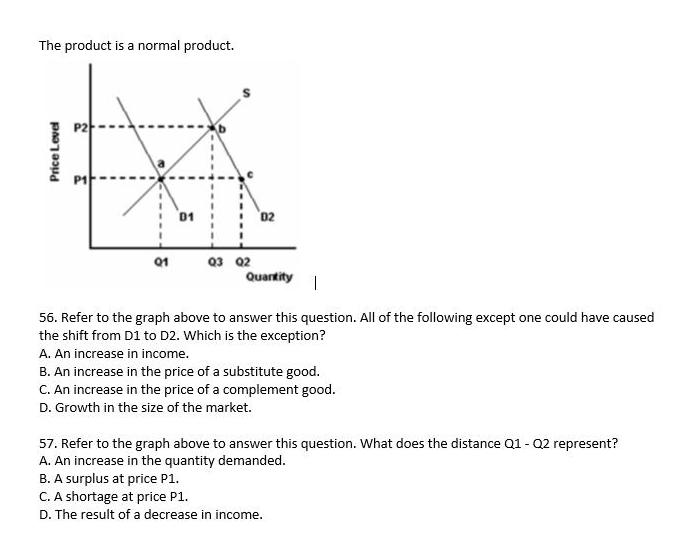
56. Refer to the graph above to answer this question. All of the following except one could have caused the shift from D1 to D2.

56. Refer to the graph above to answer this question. All of the following except one could have caused the shift from D1 to D2. Which is the exception?
A. An increase in income.
B. An increase in the price of a substitute good.
C. An increase in the price of a complement good.
D. Growth in the size of the market.
57. Refer to the graph above to answer this question. What does the distance Q1 - Q2 represent?
A. An increase in the quantity demanded.
B. A surplus at price P1.
C. A shortage at price P1.
D. The result of a decrease in income.
58. Refer to the graph above to answer this question. What does the distance Q1 to Q3 represent?
A. The increase in equilibrium quantity traded resulting from an increase in demand.
B. The decrease in equilibrium quantity traded resulting from an increase in demand.
C. The increase in equilibrium quantity traded resulting from an increase in quantity demanded.
D. The increase in equilibrium quantity traded resulting from an increase in quantity supplied.
E. A shortage at price P2.
59. What is the effect of an increase in the price of resources?
A. It will cause a decrease in the quantity supplied.
B. It will cause an increase in demand.
C. It will cause a decrease in demand.
D. It will cause an increase in supply.
E. It will cause a decrease in supply.
60. What is the effect of an improvement in technology?
A. It will cause a increase in the quantity supplied.
B. It will cause an increase in demand.
C. It will cause a decrease in demand.
D. It will cause an increase in supply.
E. It will cause a decrease in supply.
61. What is the effect of a decrease in business taxes?
A. It will cause an increase in the quantity supplied.
B. It will cause an increase in demand.
C. It will cause a decrease in demand.
D. It will cause an increase in supply.
E. It will cause a decrease in supply.
The product is a normal product. P2 02 Q3 02 Quartity 01 56. Refer to the graph above to answer this question. All of the following except one could have caused the shift from D1 to D2. Which is the exception? A. An increase in income. B. An increase in the price of a substitute good. C. An increase in the price of a complement good. D. Growth in the size of the market. 57. Refer to the graph above to answer this question. What does the distance Q1 - Q2 represent? A. An increase in the quantity demanded. B. A surplus at price P1. C. A shortage at price P1. D. The result of a decrease in income. Price Level
Step by Step Solution
There are 3 Steps involved in it
Step: 1
Ans 56 Exception is an increase in the price of a complement good Therefo...
Get Instant Access to Expert-Tailored Solutions
See step-by-step solutions with expert insights and AI powered tools for academic success
Step: 2

Step: 3

Ace Your Homework with AI
Get the answers you need in no time with our AI-driven, step-by-step assistance
Get Started


