Answered step by step
Verified Expert Solution
Question
1 Approved Answer
The question is in the attached photo. You should draw a PPC for Mexico and China showing comparative advantage. Part 1. Worked Example: The chort
The question is in the attached photo. You should draw a PPC for Mexico and China showing comparative advantage.
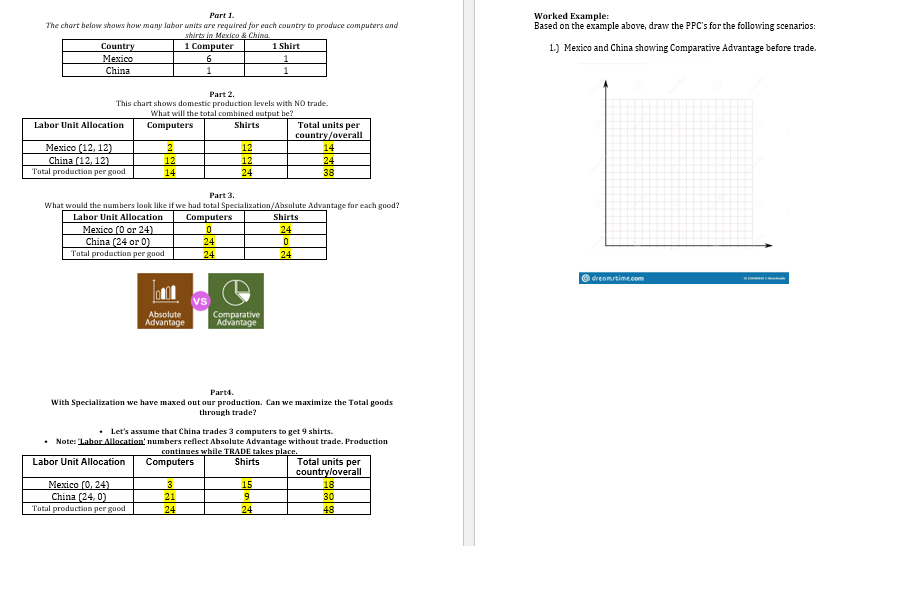
Part 1. Worked Example: The chort below shows how many labor waits are required for each country to produce computers and Based on the example above, draw the PPC's for the following scenarios: Shirts in Mexico & China Country 1 Computer 1 Shirt 1.] Mexico and China showing Comparative Advantage before trade. Mexico China Part 2. This chart shows domestic production levels with NO trade. What will the total combined output be? Labor Unit Allocation Computers Shirts Total units per country /overall Mexico (12, 12) 14 China (12, 12) 12 12 24 Total production per good 14 24 38 Part 3. What would the numbers look like if we had total Specialization/ Absolute Advantage for each good? Labor Unit Allocation Computers Shirt Mexico (0 or 24) 24 China (24 or 0) 24 Total production per good 24 24 VS Absolute Comparative Advantage Advantage Part4. With Specialization we have maxed out our production. Can we maximize the Total goods through trade? . Let's assume that China trades 3 computers to get 9 shirts. . Note: Labor Allocation' numbers reflect Absolute Advantage without trade. Production continues while TRADE takes place. Labor Unit Allocation Computers Shirts Total units per country/overall Mexico [0, 24) 15 18 China (24, 0) 21 30 Total production per good 24 24 48Step by Step Solution
There are 3 Steps involved in it
Step: 1
Get Instant Access to Expert-Tailored Solutions
See step-by-step solutions with expert insights and AI powered tools for academic success
Step: 2
Step: 3
Ace Your Homework with AI
Get the answers you need in no time with our AI-driven, step-by-step assistance
Get Started