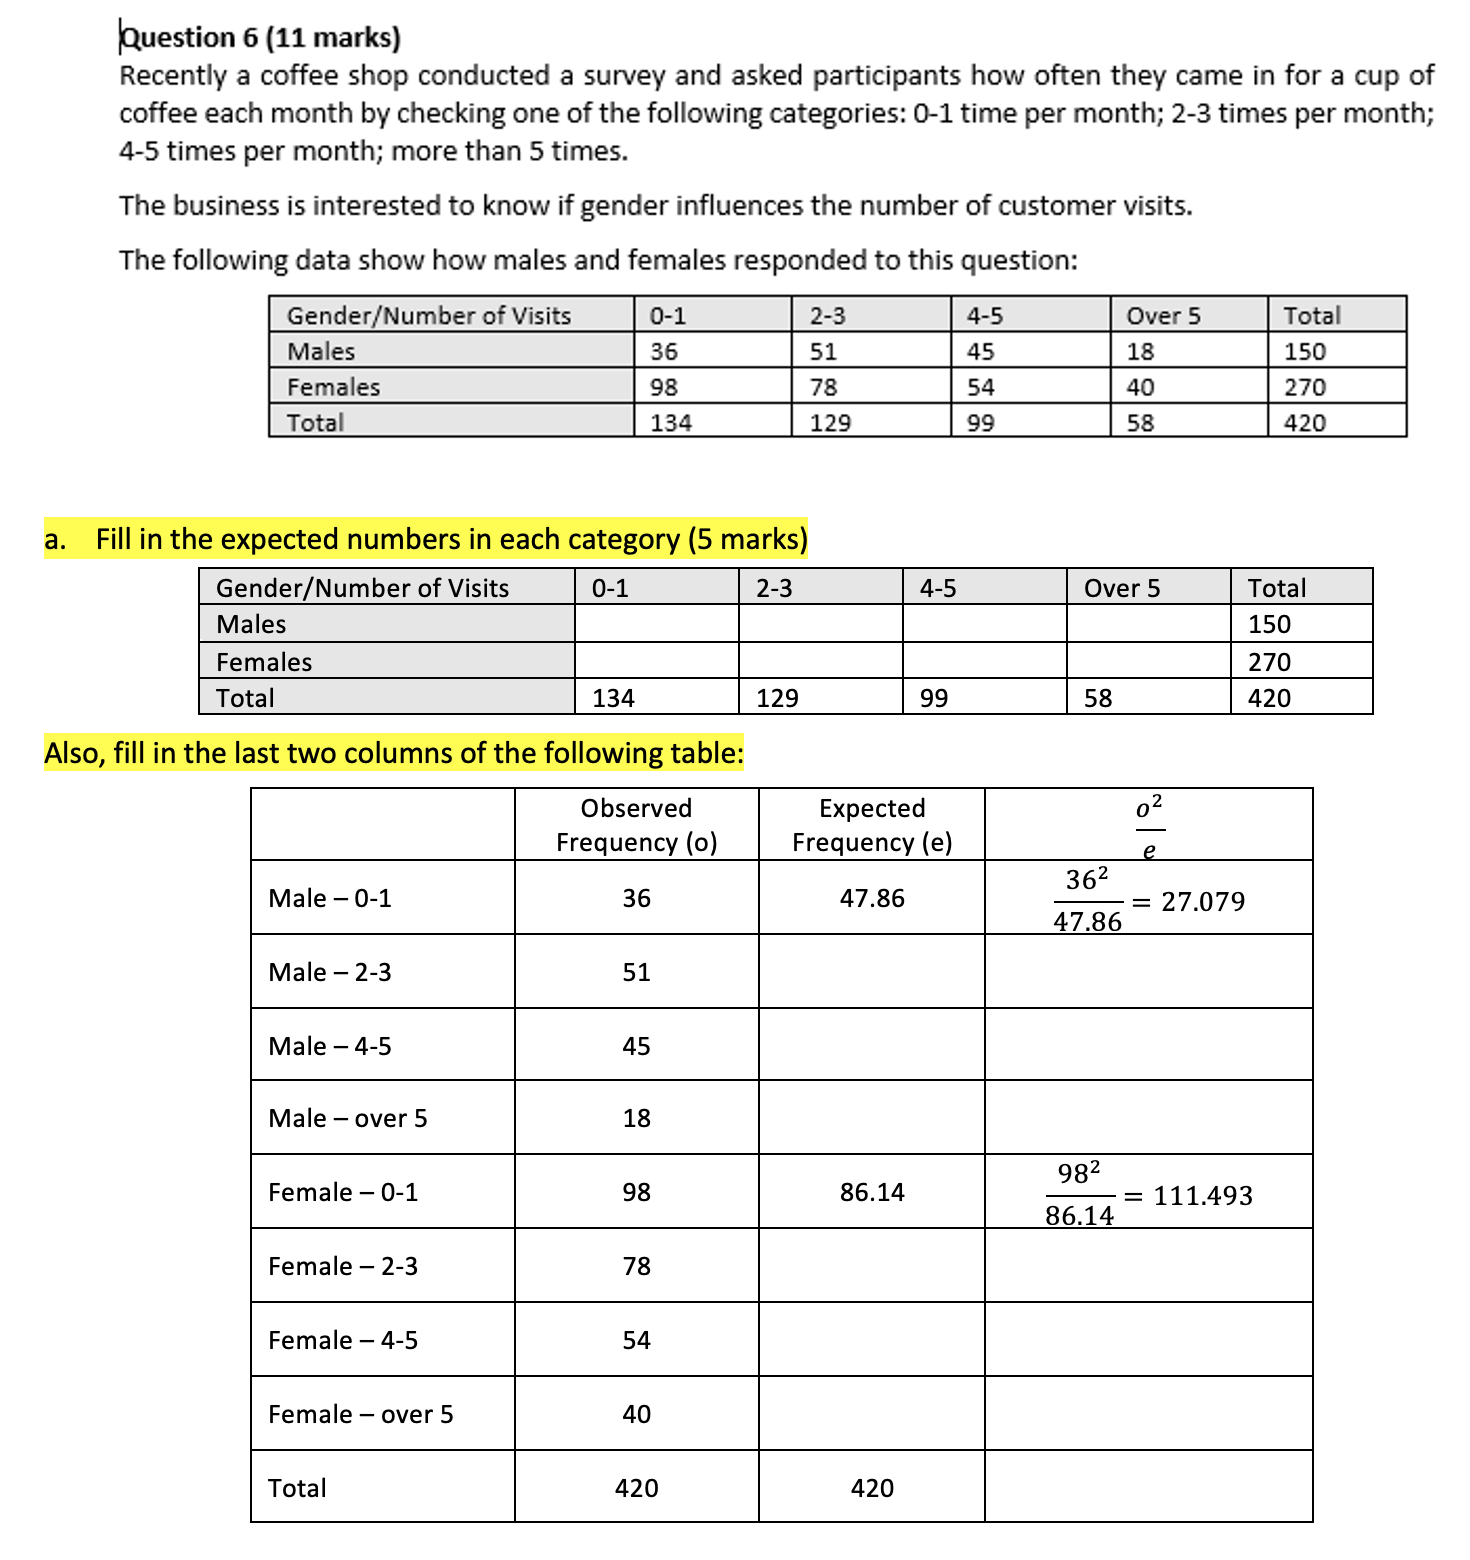
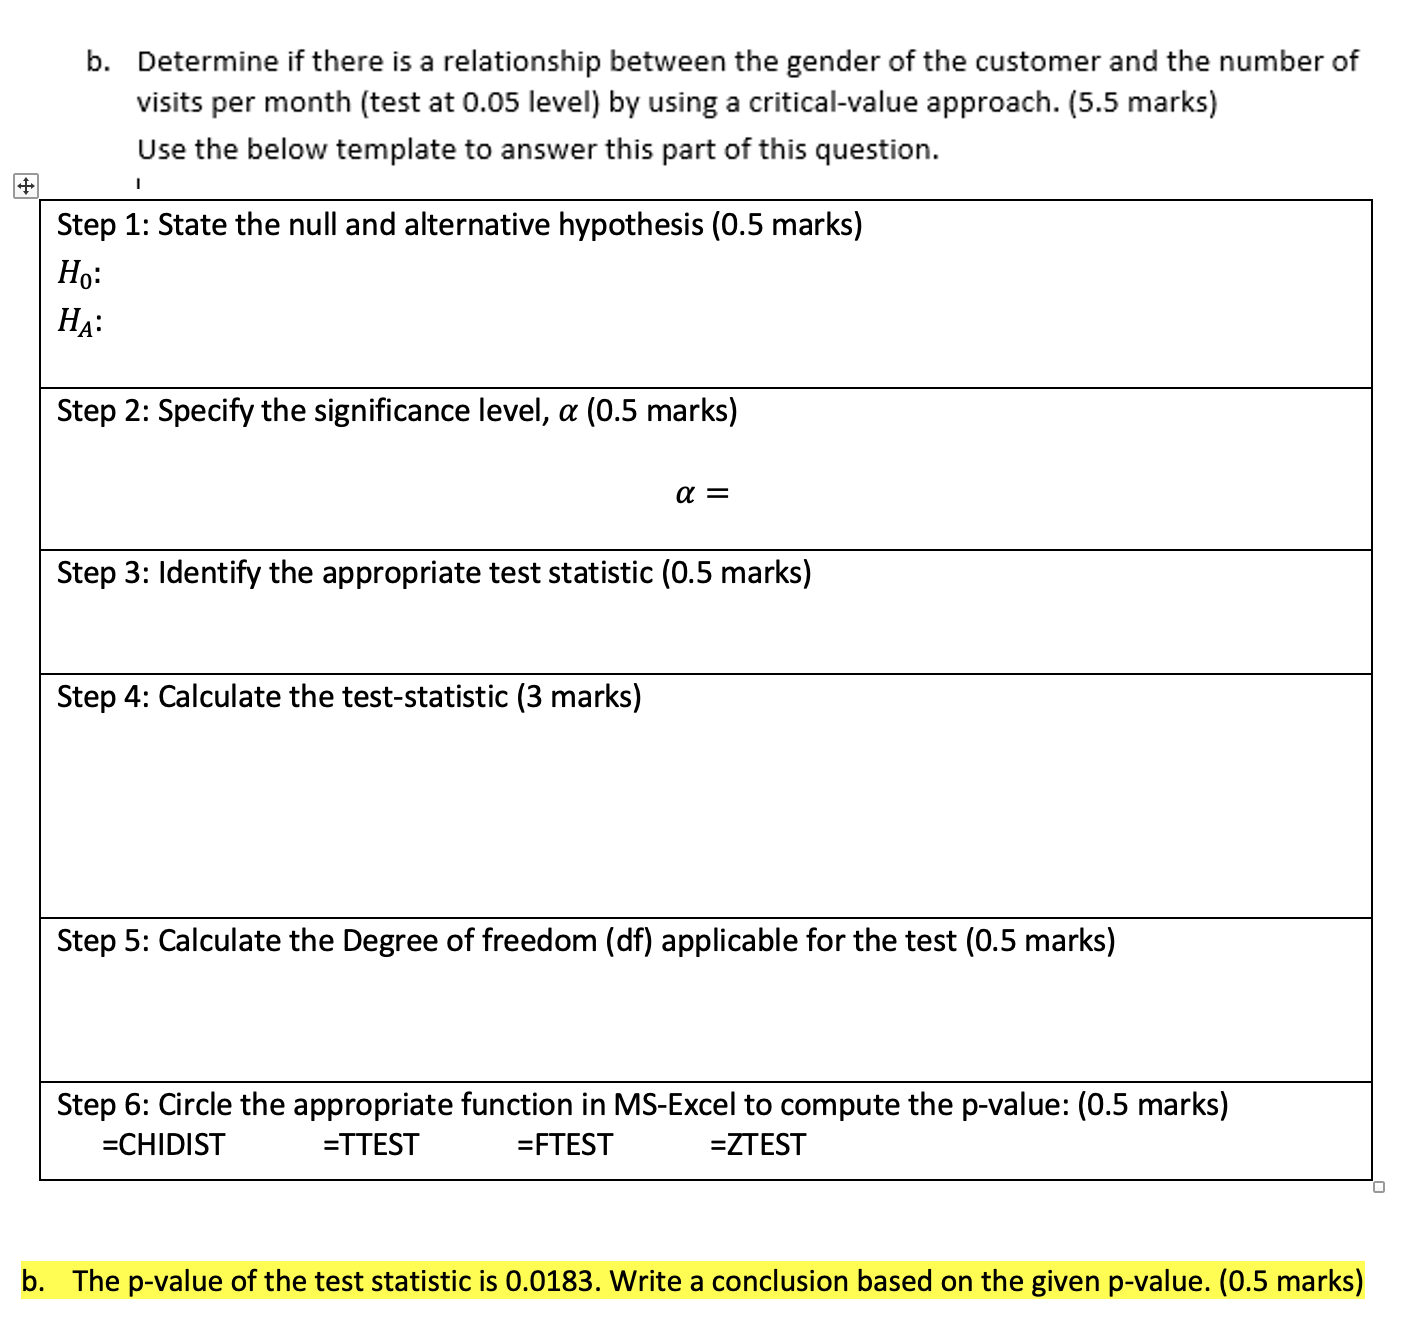
the question is in the pics
Question 6 (11 marks) Recently a coffee shop conducted a survey and asked participants how often they came in for a cup of coffee each month by checking one of the following categories: 0-1 time per month; 2-3 times per month; 4-5 times per month; more than 5 times. The business is interested to know if gender influences the number of customer visits. The following data show how males and females responded to this question: Gender/Number of Visits 0-1 2-3 4-5 Over 5 Total Males 36 51 45 18 150 Females 98 78 54 40 270 Total 134 129 99 58 420 a. Fill in the expected numbers in each category (5 marks) Gender/Number of Visits 0-1 2-3 4-5 Over 5 Total Males 150 Females 270 Total 134 125 99 58 420 Also, fill in the last two columns of the following table: Observed Expected Frequency (o) Frequency (e) 362 Male - 0-1 36 47.86 47.86 = 27.079 Male - 2-3 51 Male - 4-5 45 Male - over 5 18 982 Female - 0-1 98 86.14 86.14 = 111.493 Female - 2-3 78 Female - 4-5 54 Female - over 5 40 Total 420 420b. Determine if there is a relationship between the gender of the customer and the number of visits per month (test at 0.05 level) by using a critical-value approach. (5.5 marks) Use the below template to answer this part of this question. Step 1: State the null and alternative hypothesis (0.5 marks) Step 2: Specify the significance level, a (0.5 marks) a: = Step 3: Identify the appropriate test statistic (0.5 marks) Step 4: Calculate the test-statistic (3 marks) Step 5: Calculate the Degree of freedom (df) applicable for the test (0.5 marks) Step 6: Circle the appropriate function in MSExcel to compute the p-value: (0.5 marks) =CH|D|ST =TI'EST =FTEST =ZTEST b. The p-value of the test statistic is 0.0183. Write a conclusion based on the given p-value. (0.5 marks)