THE QUESTION SAYS
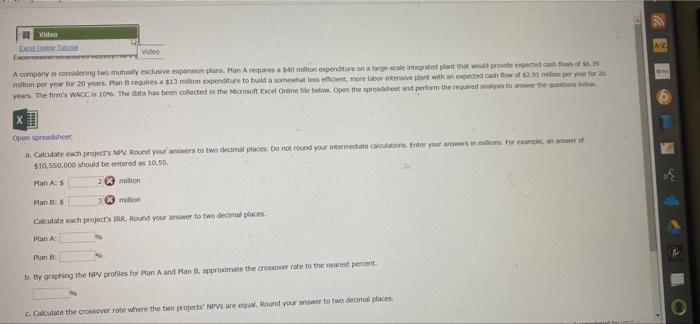
A company is considering two mutually exclusive expansion plans. Plan A requires a $40 million expenditure on a large-scale integrated plant that would provide expected cash flows of $6.39 million per year for 20 years. Plan B requires a $13 million expenditure to build a somewhat less efficient, more labor-intensive plant with an expected cash flow of $2.91 million per year for 20 years. The firm's WACC is 10%. The data has been collected in the Microsoft Excel Online file below. Open the spreadsheet and perform the required analysis to answer the questions below.
-
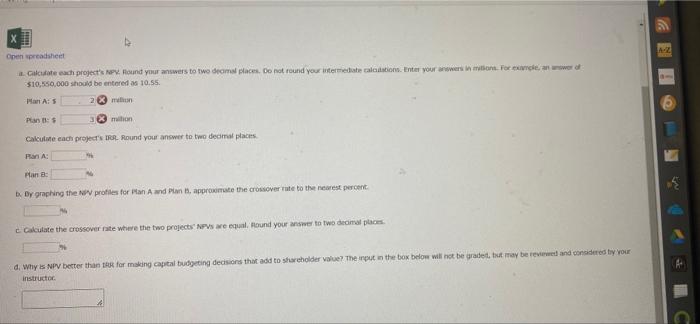
Calculate each project's NPV. Round your answers to two decimal places. Do not round your intermediate calculations. Enter your answers in millions. For example, an answer of $10,550,000 should be entered as 10.55.
Plan A: $ million
Plan B: $ million
Calculate each project's IRR. Round your answer to two decimal places.
Plan A: %
Plan B:%
-
By graphing the NPV profiles for Plan A and Plan B, approximate the crossover rate to the nearest percent.
%
-
Calculate the crossover rate where the two projects' NPVs are equal. Round your answer to two decimal places.
%
-
Why is NPV better than IRR for making capital budgeting decisions that add to shareholder value? The input in the box below will not be graded, but may be reviewed and considered by your instructor.
| | | | | | | | | | | | | | | | | | | | | | | | | |
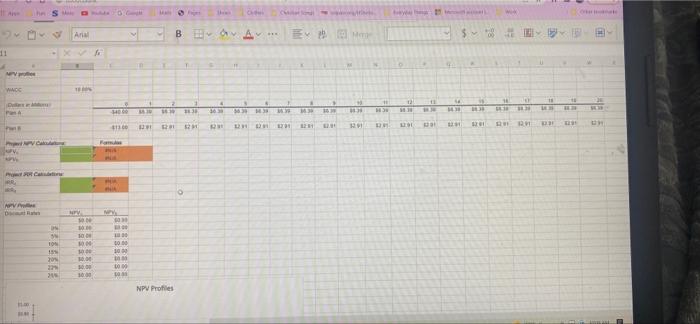
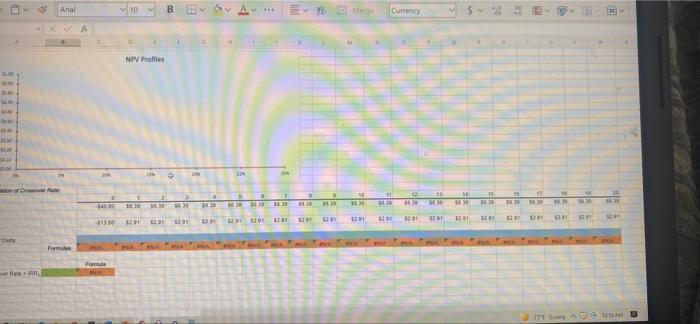
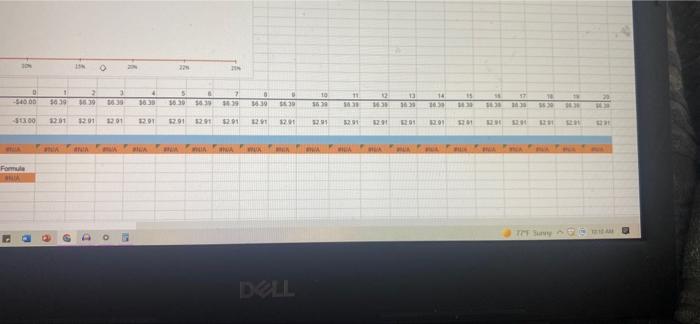
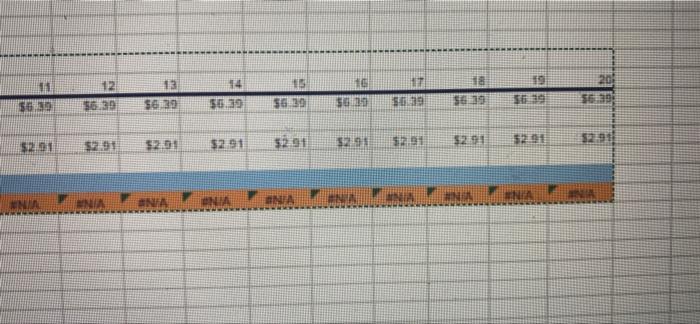
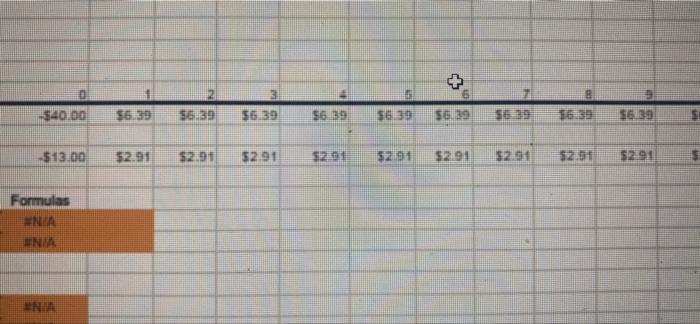
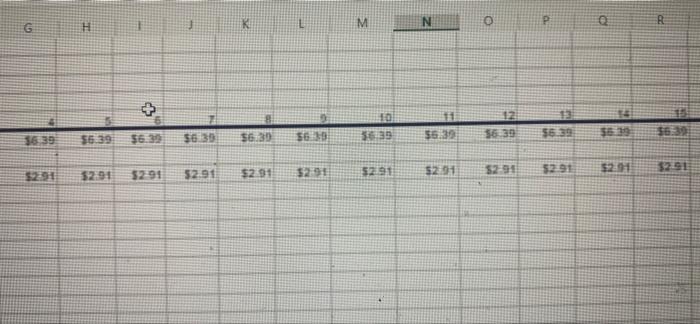
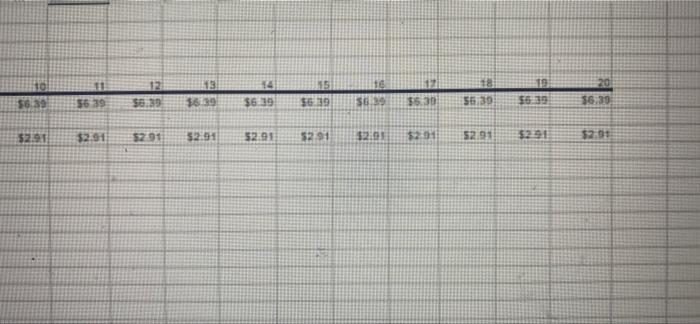
| (Dollars in Millions) | | 0 | 1 | 2 | 3 | 4 | 5 | 6 | 7 | 8 | 9 | 10 | 11 | 12 | 13 | 14 | 15 | 16 | 17 | 18 | 19 | 20 | | | |
| Plan A | | -$40.00 | $6.39 | $6.39 | $6.39 | $6.39 | $6.39 | $6.39 | $6.39 | $6.39 | $6.39 | $6.39 | $6.39 | $6.39 | $6.39 | $6.39 | $6.39 | $6.39 | $6.39 | $6.39 | $6.39 | $6.39 | | | |
| | | | | | | | | | | | | | | | | | | | | | | | | |
| Plan B | | -$13.00 | $2.91 | $2.91 | $2.91 | $2.91 | $2.91 | $2.91 | $2.91 | $2.91 | $2.91 | $2.91 | $2.91 | $2.91 | $2.91 | $2.91 | $2.91 | $2.91 | $2.91 | $2.91 | $2.91 | $2.91 | | | |
| | | | | | | | | | | | | | | | | | | | | | | | Calculation of Crossover Rate: | | | | | | | | | | | | | | | | | | | | | | | | | 0 | 1 | 2 | 3 | 4 | 5 | 6 | 7 | 8 | 9 | 10 | 11 | 12 | 13 | 14 | 15 | 16 | 17 | 18 | 19 | 20 | | Plan A | |
Video Excel Online Tutona Ester PE Video A company is considering two mutually exclusive expansion plans: Plan A requires a $40 million expenditure on a large-scale integrated plant that would provide expected cash flow of $6.39 million per year for 20 years. Plan B requires a $13 million expenditure to build a somewhat less efficient, more labor-intensive plant with an expected cash flow of $2.91 milion per year for 20 years. The firm's WACC is 10%. The data has been collected in the Microsoft Excel Online file below. Open the spreadsheet and perform the required analysis to answer the questions below Open spreadsheet a. Calculate each project's NPV. Round your answers to two decimal places. Do not round your intermediate calculations. Enter your answers in millions. For example, an answer of $10,550,000 should be entered as 10.55. Plan A: 2 milion milion Plan B: $ Calculate each project's IRR. Round your answer to two decimal places. Plan A Plan B b. By graphing the NPV profiles for Plan A and Plan 8, approximate the crossover rate to the nearest percent. c. Calculate the crossover rate where the two projects' NPVs are equal. Round your answer to two decimal places. A-Z W Open spreadsheet A-Z a Calculate each project's NPV. Round your answers to two deamal places. Do not round your intermediate calculations. Enter your answers in milions. For example, an answer of $10,550,000 should be entered as 10.55. PO Plan A: 5 milion Plan 1: $ milion Calculate each project's IRR. Round your answer to two decimal places. Plan A Plan B: b. By graphing the NIV profiles for Plan A and Plan , approximate the crossover rate to the nearest percent. c. Calculate the crossover rate where the two projects NPVs are equal. Round your answer to two decimal places. d. Why is NPV better than IR for making capital budgeting decisions that add to shareholder value? The input in the box below will not be graded, but may be reviewed and considered by your instructor. C ADAG MPV pr WACC D PA sim The S PNP Calculating PR Catiny MPV DR DN ON TON 15% 20% 22% 21% 10 Arial TEPON 50.00 10.10 10,00 $0.00 10:00 10.00 $0.00 10:00 $40.00 M 413.00 1291 Formula www 5030 00 1000 40.00 10:00 www. 1000 300 NEW T THE BA CHESS 1425 1291 NPV Profiles 14 36.30 12 *** 36.34 143 AN DH DR Tengkor A EM M4.30 14.9 22. 16.25 SCH 1291 # ICH iss y O 12 14.30 1291 TH ww 201 S 14.30 41% $ 1471 is ICH WX 4201 16 54.34 1291 10 11.3 142 U 18 KEN HECH 16 O RENE SER 1291 CH SLIM ww ww ww ww pe Dets B Rate RR Anal Formal 44000 -$13.00 PER Formule HEA 10 DE NPV Profiles 1030 34.30 1824 B By 4 ACHE $201 $2.91 SON 54.3 12.M 10.35 $2.91 143 62.91 16.30 12:31 1439 1825 14.30 ien H 19 14.38 RB VA 4 Currency B 11 14.30 62.91 42:01 SNE 12 201 ICH KW 0 5- 95 14.30 $2.91 1281 11 18 34.38 A. 1.3 1201 201 Lausnis mix 18 17 21.30 14.30 1825 1673 130 18.30 SEM IPI SU NA 30% Formul D Wie 1 COOPS BCD 6091 P -$13.00 12.01 12.01 NIE 2 6 3 BC98 NO 4 F 41 16:38 1201 12.91 $2.91 228 5 995 6 1625 VI 214 7 6095 D 16.30 $2.91 $2.91 WAK DELL VINE 10 stys BC 95 SEUS 12.91 $2.91 WIN $2.91 Y VI Z C SCUE 16:29 10:25 1620 14 16.39 16.36 15 ICH 1025 17 NE BEVE BCS5 1625 16:21 1475 wa Ang Le 16.38 $2.91 10 14.30 5231 0 54000 $13.00 Ve $0.00 $0.00 $0.00 $0.00 $0.00 10.00 10 0. 1 $6.39 $2.91 B E 2 15.39 $2.91 F 13 $6.39 $2.91 4 $6.39 82.91 35.39 $2.91 *** 5 $0.39 $2.91 7 6 $6.39 $2.01 N 6 THE Merge M 1 $6.39 36.39 $2.91 $2.91 10 $0.30 $2.91 N mmg Currency 11 14.30 $2.91 O W 12 13 10.39 16.39 $2.91 $2.91 D 14 16.30 $2.91 11 15 $6.39 16:25 E 1 16 17 15.30 $8.39 62.91 $2.91 18 12.01 [X] 19 20 11.39 16.30 $2.91 2291 XX ACAT 0 -$40.00 -$13.00 #N/A Formula #N/A 45% $6.39 $6.30 $6.39 $2.91 $2.91 $2.91 #N/A #N/A #N/A 20% 22% 5 $6.39 $6.39 $2.91 #N/A 25% 6 $6.39 $6.39 $6.39 $2.91 $2.91 $2.91 $2.01 #N/A #N/A #N/A $6.39 $2.91 10 $6.39 $2.91 22% 25% 6 7 B $6.39 $6.30 $6.39 $6.30 $6.39 $2.91 $2.91 $2.91 $2.91 $2.91 #NIA #NA VINE 0 10 $6.39 $2.91 BEE $6.39 $2.91 12 $6.39 $2.91 13 $6.39 $2.91 #NA 14 15 $6.39 $6.39 $2.91 $2.91 $2.91 N ENIA ONIA 16 $6.39 $6.3 $2.9 11 $6.39 $2.91 #NIA 12 $6.39 $2.91 ENIA 13 $6.39 $2.01 #N/A 14 $6.39 $2.91 #NIA 15 $6.39 $2.91 #N/A 16 $6.30 $2.91 17 $6.39 $2.91 18 $6.39 $2.91 www 19 $6.39 $2.91 VINE 20 $6.39 $2.91 D 3 -$40.00 $6.39 $6.39 $6.39 -$13.00 $2.91 $2.91 $2.91 29 Formulas #NIA ENIA #NIA $6.39 + 4 $6.39 $6.39 $6.39 $2.91 $2.91 $2.91 $6.39 $2.91 $2.91 MA G $6.39 $2.91 H $6.39 $2.91 $2.91 $6.39 $6.39 $2.91 K BE HE G $6.39 $6.30 $2.91 16:25 M GE: 95 $2.91 N $6.39 $2.91 O 12 $6.39 $2.91 P 13 $6.39 $2.91 R 14 $6.39 $6.39 $2.91 $2.91 10 $6.39 $2.91 GE 95 $2.91 12 GE:95 1625 13 14 $6.39 $6.39 $2.91 16:25 15 GE: 95 $2.91 16 $6.39 16:25 17 GESS 1624 18 56.30 $6.39 $2.91 613 16:25 201 GE'95 $2.91