THE questions will be on file please i had to take multiple screenshoot to show every thing
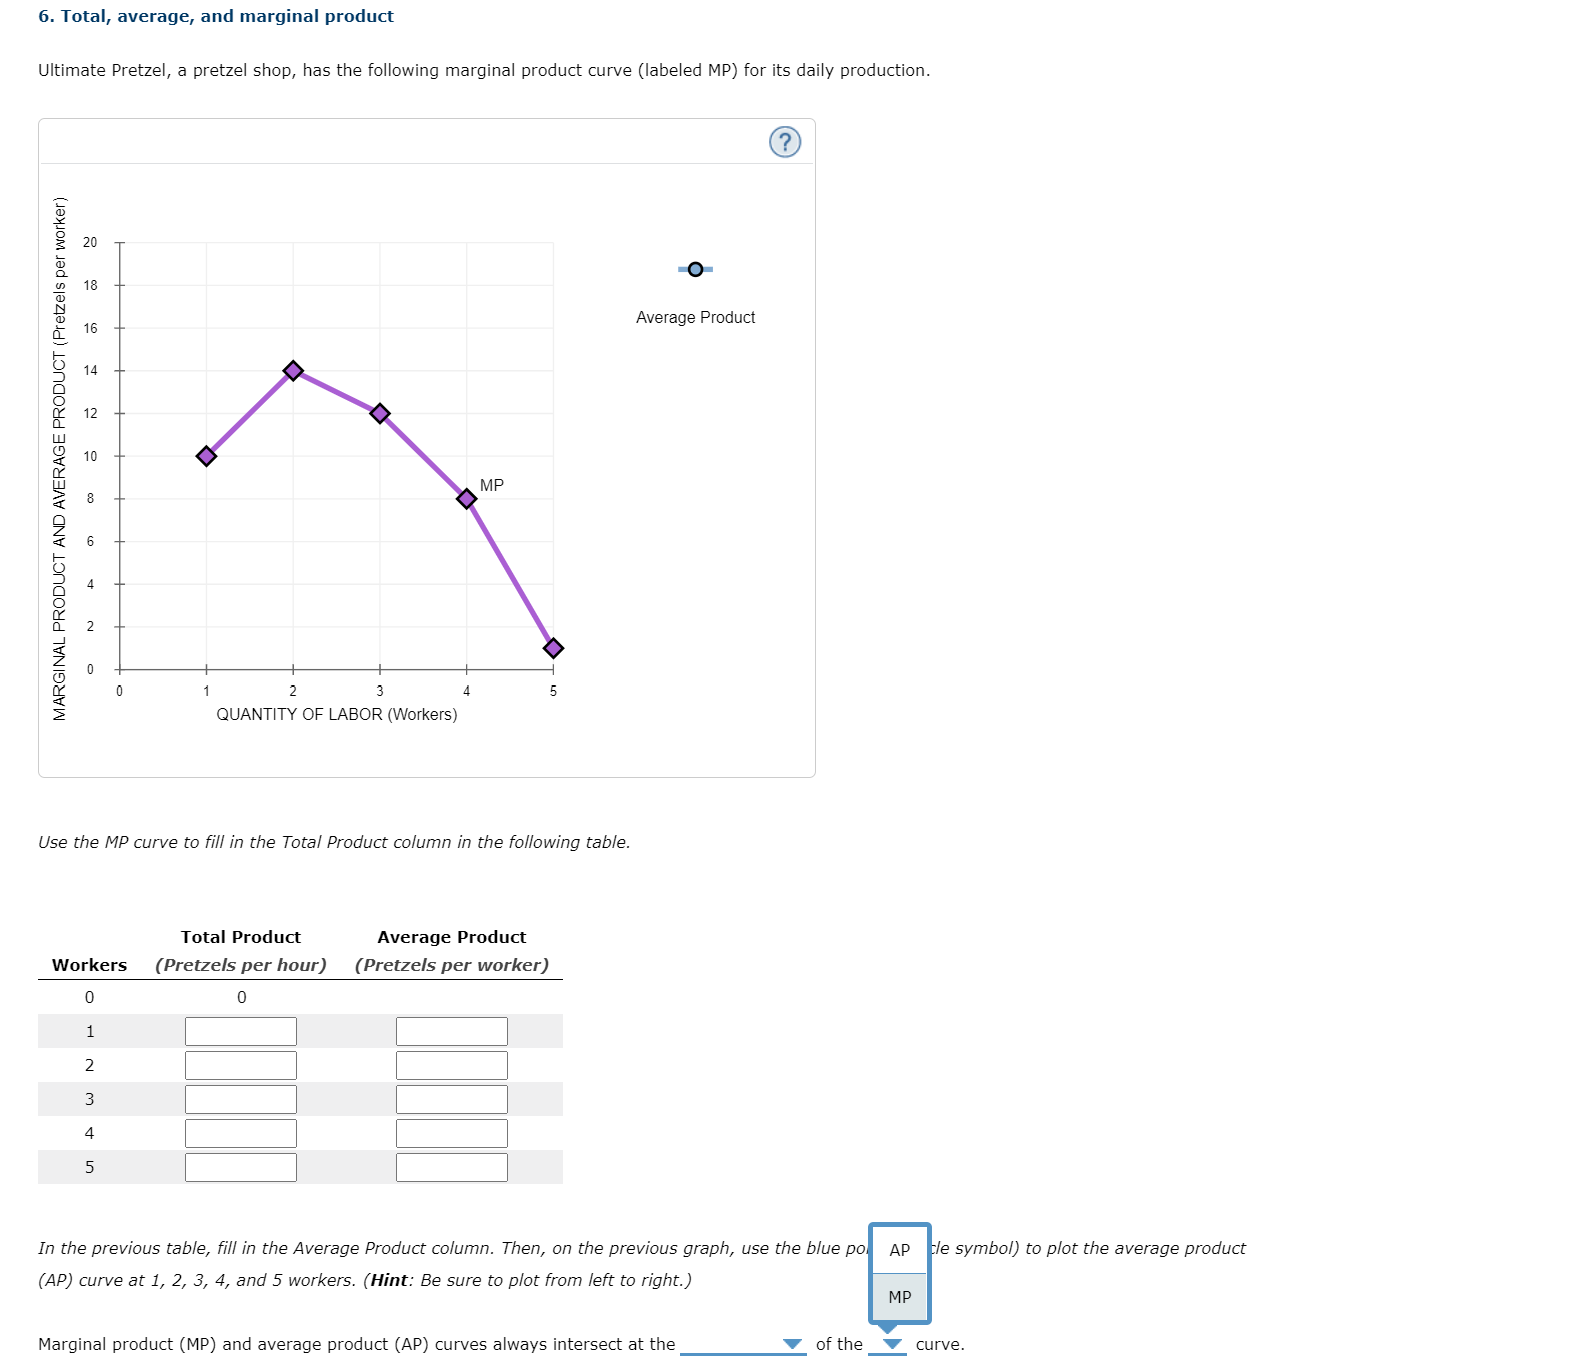
6. Total, average, and marginal product Ultimate Pretzel, a pretzel shop, has the following marginal product curve (labeled MP) for its daily production. MARGINAL PRODUCT AND AVERAGE PRODUCT (Pretzels per worker) Average Product MP N QUANTITY OF LABOR (Workers) Use the MP curve to fill in the Total Product column in the following table. Total Product Average Product Workers (Pretzels per hour) (Pretzels per worker) w In the previous table, fill in the Average Product column. Then, on the previous graph, use the blue pol AP cle symbol) to plot the average product (AP) curve at 1, 2, 3, 4, and 5 workers. (Hint: Be sure to plot from left to right.) MP Marginal product (MP) and average product (AP) curves always intersect at the of the curve.6. Total, average, and marginal product Ultimate Pretzel, a pretzel shop, has the following marginal product curve (labeled MP) for its daily production. ? MARGINAL PRODUCT AND AVERAGE PRODUCT ( Pretzels per worker) Average Product QUANTITY OF LABOR (Workers) Use the MP curve to fill in the Total Product column in the following table. Total Product Average Product Workers (Pretzels per hour) (Pretzels per worker) 0 w 5 In the previous table, fill in the Average Product column. Then, on the previous minimum he blue points (circle symbol) to plot the average product (AP) curve at 1, 2, 3, 4, and 5 workers. (Hint: Be sure to plot from left to right maximum Marginal product (MP) and average product (AP) curves always intersect at the of the curve.6. Total, average, and marginal product Ultimate Pretzel, a pretzel shop, has the following marginal product curve (labeled MP) for its daily production. (?) MARGINAL PRODUCT AND AVERAGE PRODUCT (Pretzels per worker) Average Product MP ON on - QUANTITY OF LABOR (Workers) Use the MP curve to fill in the Total Product column in the following table. Total Product Average Product Workers (Pretzels per hour) (Pretzels per worker) 0 2 A W UT In the previous table, fill in the Average Product column. Then, on the previous graph, use the blue points (circle symbol) to plot the average product (AP) curve at 1, 2, 3, 4, and 5 workers. (Hint: Be sure to plot from left to right.) Marginal product (MP) and average product (AP) curves always intersect at the of the curve


