THE questions will be on file please i had to take multiple screenshoot to show every thing
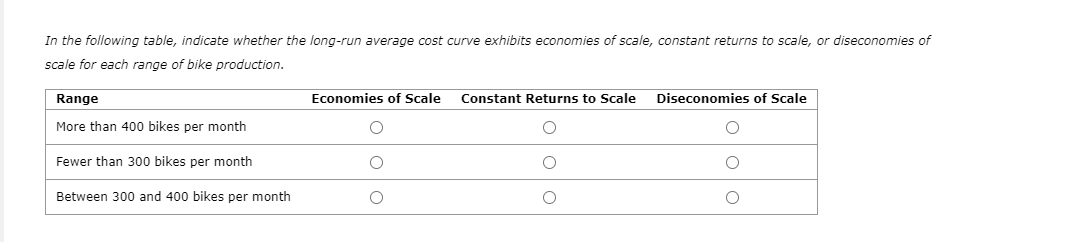
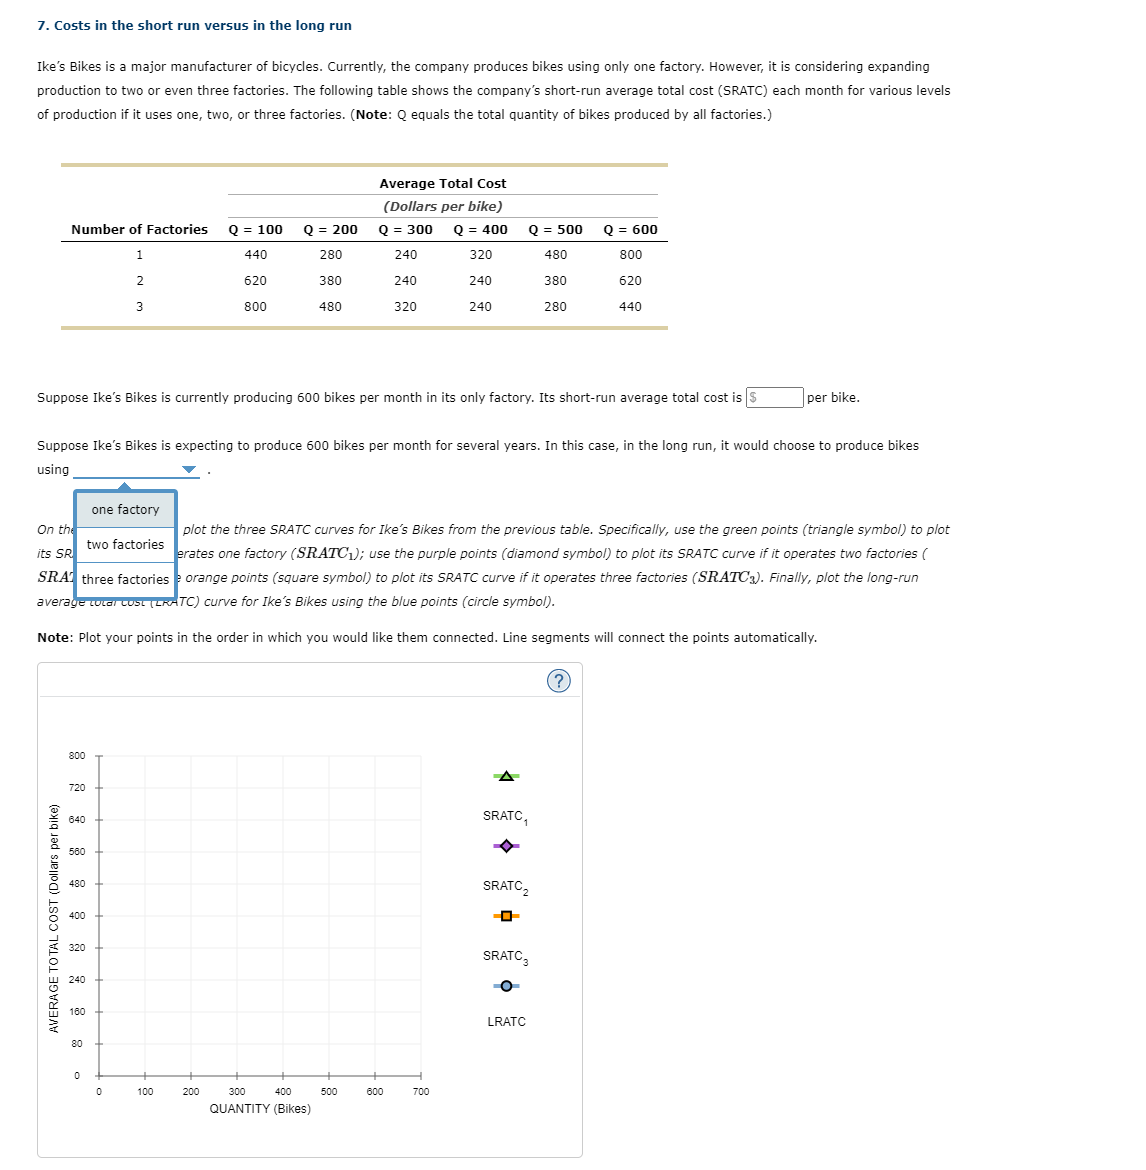
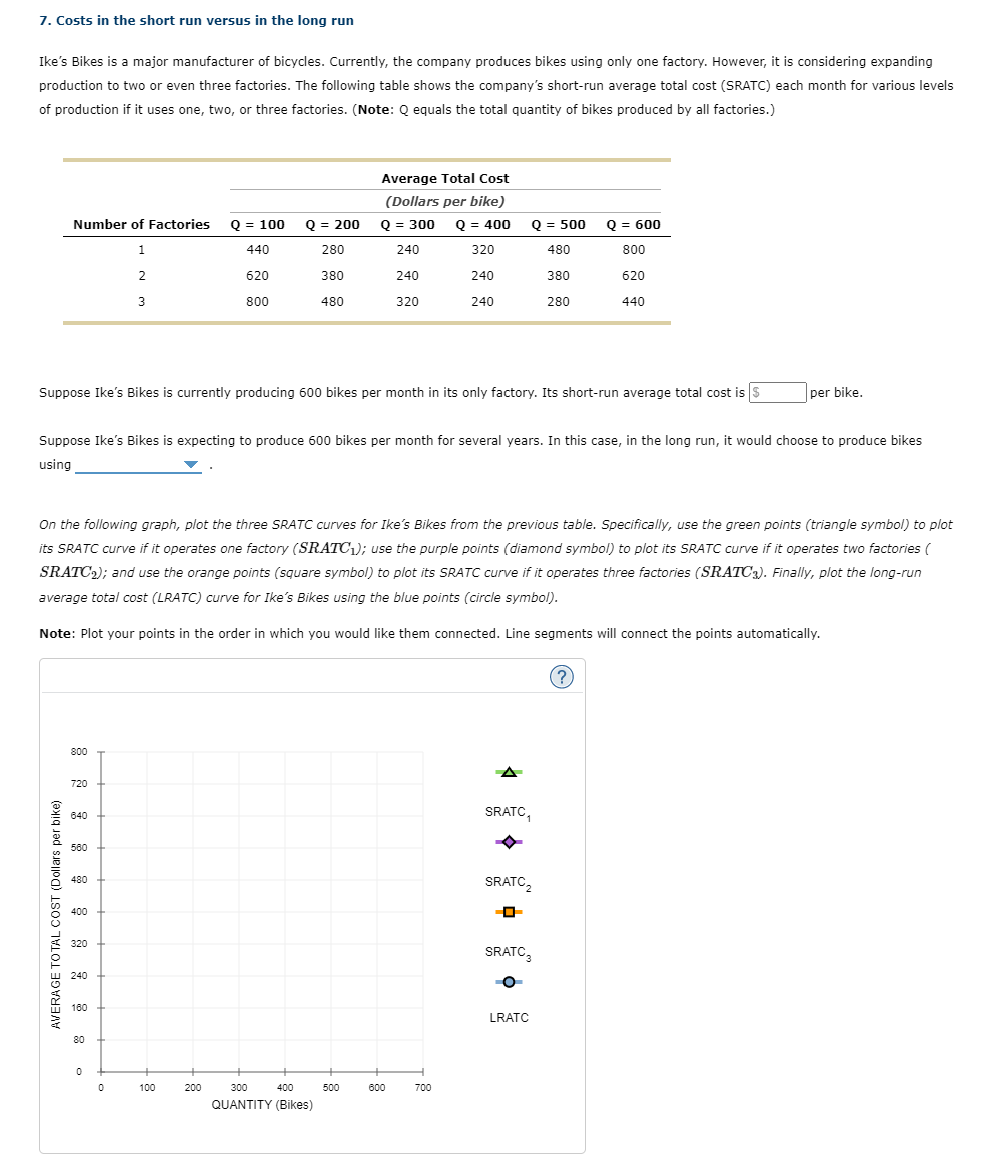
In the following table, indicate whether the long-run average cost curve exhibits economies of scale, constant returns to scale, or diseconomies of scale for each range of bike production. Range Economies of Scale Constant Returns to Scale Diseconomies of Scale More than 400 bikes per month O O O Fewer than 300 bikes per month O O O Between 300 and 400 bikes per month O O O7. Costs in the short run versus in the long run Ike's Bikes is a major manufacturer of bicycles. Currently, the company produces bikes using only one factory. However, it is considering expanding production to two or even three factories. The following table shows the company's short-run average total cost (SRATC) each month for various levels of production if it uses one, two, or three factories. (Note: Q equals the total quantity of bikes produced by all factories.) Average Total Cost (Dollars per bike) Number of Factories Q = 100 Q = 200 Q = 300 Q = 400 Q = 500 Q = 600 440 280 240 320 480 800 w I 620 380 240 240 380 $20 800 480 320 240 780 440 Suppose Ike's Bikes is currently producing 600 bikes per month in its only factory. Its short-run average total cost is |$ per bike. Suppose Ike's Bikes is expecting to produce 600 bikes per month for several years. In this case, in the long run, it would choose to produce bikes using one factory On the its SR two factories plot the three SRATC curves for Ike's Bikes from the previous table. Specifically, use the green points (triangle symbol) to plot erates one factory (SRATCy); use the purple points (diamond symbol) to plot its SRATC curve if it operates two factories ( SRA three factories e orange points (square symbol) to plot its SRATC curve if it operates three factories (SRATCy). Finally, plot the long-run average total CUSt (LRATC) curve for Ike's Bikes using the blue points (circle symbol). Note: Plot your points in the order in which you would like them connected. Line segments will connect the points automatically. (?) 800 AVERAGE TOTAL COST (Dollars per bike) SRATC , SRATC 2 -0- SRATC 3 LRATC 100 200 300 400 500 600 700 QUANTITY (Bikes)7. Costs in the short run versus in the long run Ike's Bikes is a major manufacturer of bicycles. Currently, the company produces bikes using only one factory. However, it is considering expanding production to two or even three factories. The following table shows the company's short-run average total cost (SRATC) each month for various levels of production if it uses one, two, or three factories. (Note: Q equals the total quantity of bikes produced by all factories.) Average Total Cost ( Dollars per bike) Number of Factories Q = 100 Q = 200 Q = 300 Q = 400 Q = 500 Q = 600 1 440 280 240 320 480 800 W N 620 380 240 240 380 620 800 480 320 240 280 440 Suppose Ike's Bikes is currently producing 600 bikes per month in its only factory. Its short-run average total cost is | $ per bike. Suppose Ike's Bikes is expecting to produce 600 bikes per month for several years. In this case, in the long run, it would choose to produce bikes using On the following graph, plot the three SRATC curves for Ike's Bikes from the previous table. Specifically, use the green points (triangle symbol) to plot its SRATC curve if it operates one factory (SRATCy); use the purple points (diamond symbol) to plot its SRATC curve if it operates two factories ( SRATC2); and use the orange points (square symbol) to plot its SRATC curve if it operates three factories (SRATC3). Finally, plot the long-run average total cost (LRATC) curve for Ike's Bikes using the blue points (circle symbol). Note: Plot your points in the order in which you would like them connected. Line segments will connect the points automatically. (? 800 720 AVERAGE TOTAL COST (Dollars per bike ) SRATC, SRATC2 SRATC; LRATC o 100 200 300 400 500 600 700 QUANTITY (Bikes)