

Question
The Randall Department Stores, Inc. chief executive officer (CEO) has asked you to compare the company's profit performance and financial position with the averages for
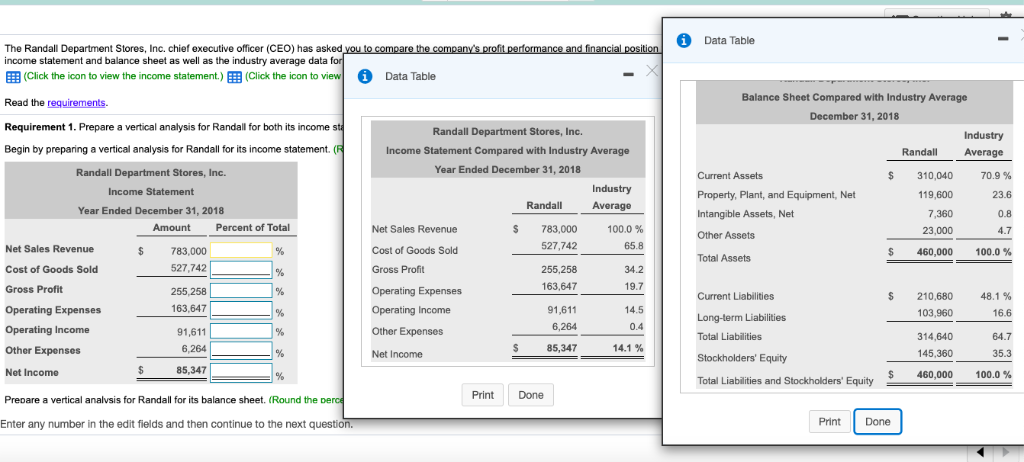 The Randall Department Stores, Inc. chief executive officer (CEO) has asked you to compare the company's profit performance and financial position with the averages for the industry. The CEO has given you the company's income statement and balance sheet as well as the industry average data for retailers. LOADING...(Click the icon to view the income statement.) LOADING...(Click the icon to view the balance sheet.) Read the requirements LOADING.... Requirement 1. Prepare a vertical analysis for Randall for both its income statement and balance sheet. Begin by preparing a vertical analysis for Randall for its income statement. (Round the percent of total amounts to one decimal place, X.X%.) Randall Department Stores, Inc. Income Statement Year Ended December 31, 2018 Amount Percent of Total Net Sales Revenue $783,000 % Cost of Goods Sold 527,742 % Gross Profit 255,258 % Operating Expenses 163,647 % Operating Income 91,611 % Other Expenses 6,264
Step by Step Solution
There are 3 Steps involved in it
Step: 1

Get Instant Access to Expert-Tailored Solutions
See step-by-step solutions with expert insights and AI powered tools for academic success
Step: 2

Step: 3
Ace Your Homework with AI
Get the answers you need in no time with our AI-driven, step-by-step assistance
Get Started
Survival Audit And Calculations Manual
Authors: Dr Joseph Lee Bounds
1st Edition
1505425573, 978-1505425574