The real Home Depote Annual report for the current year. if you need any more information let me know
(home depot) 10k annual report comment if any questions or information needed
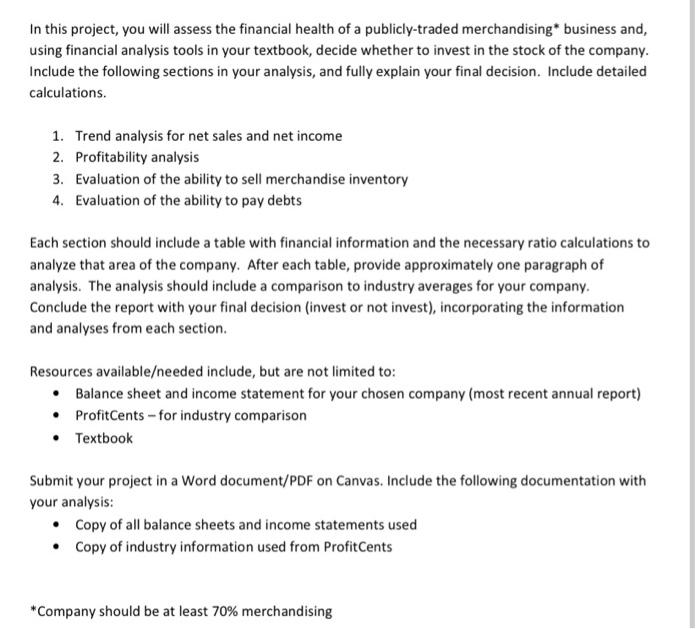
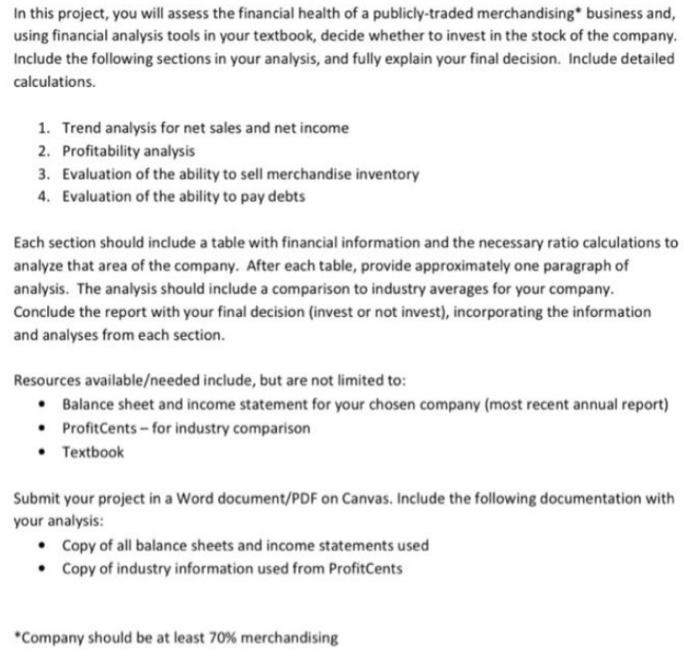
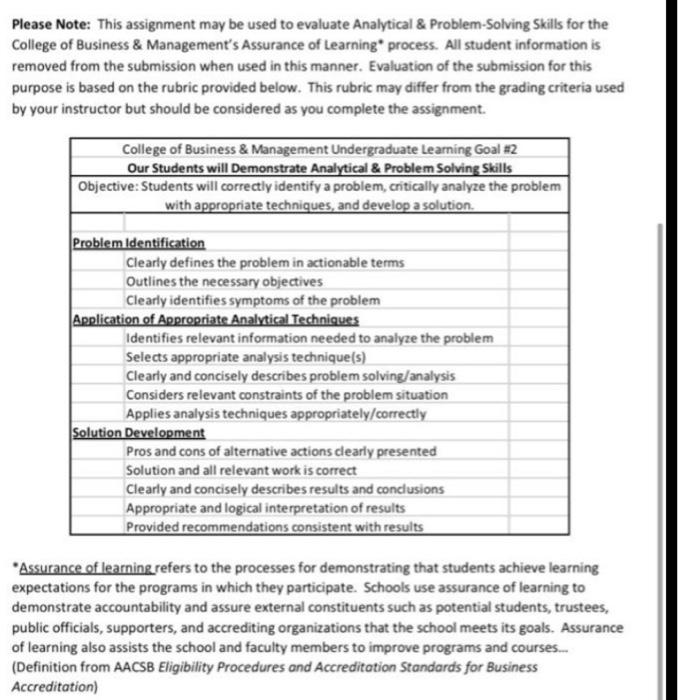
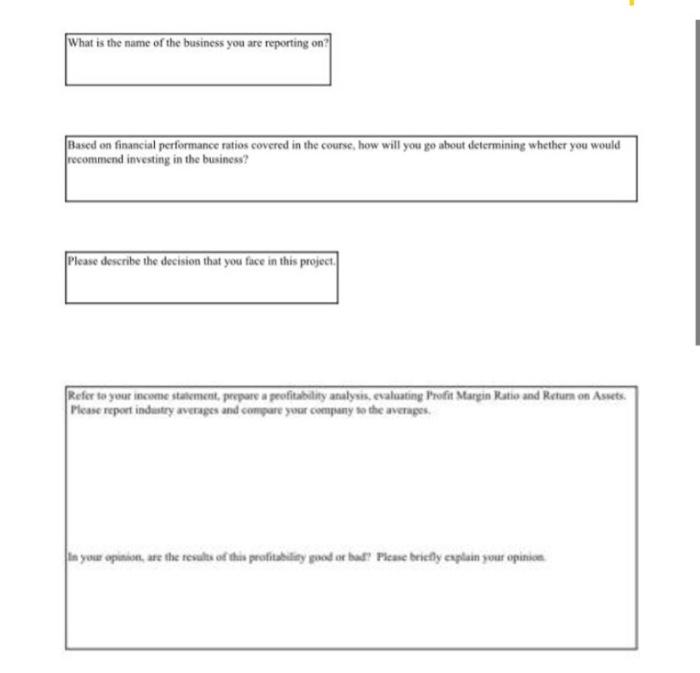
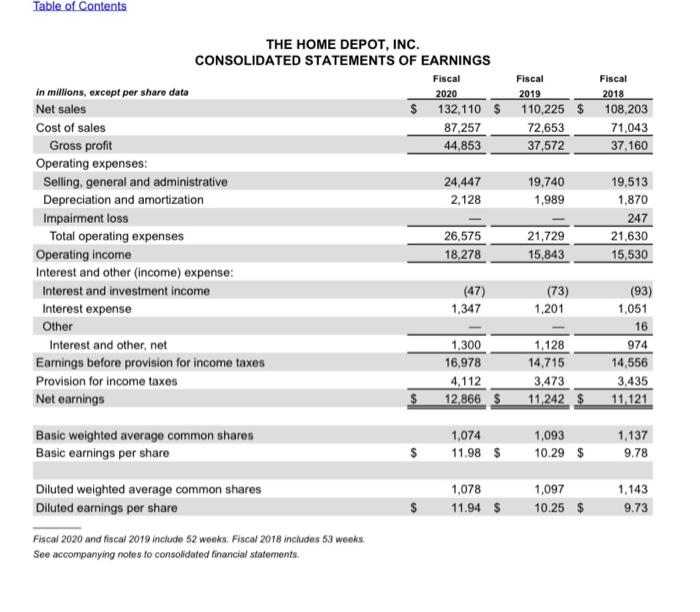
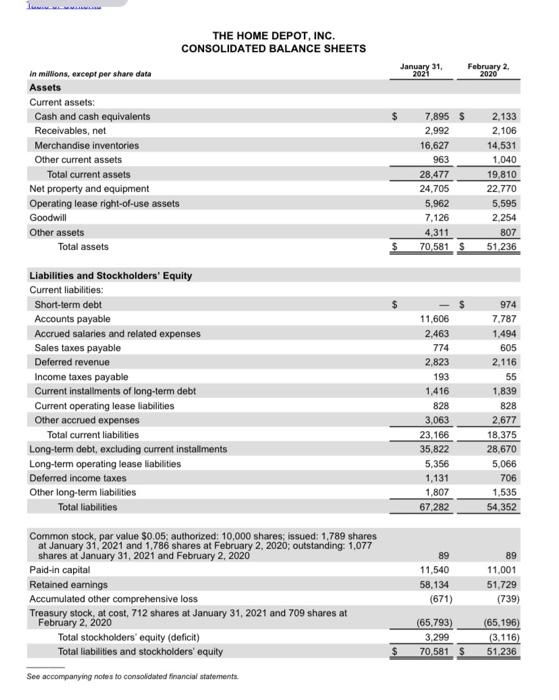
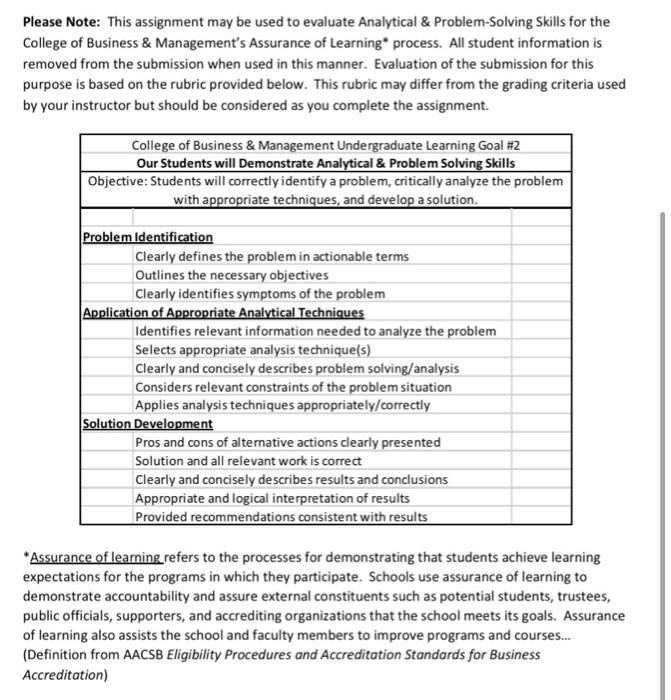
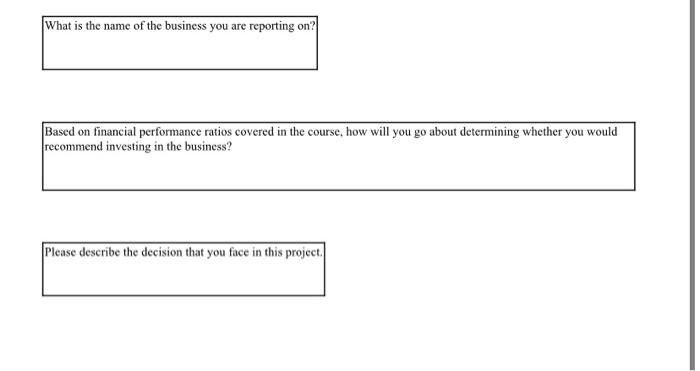
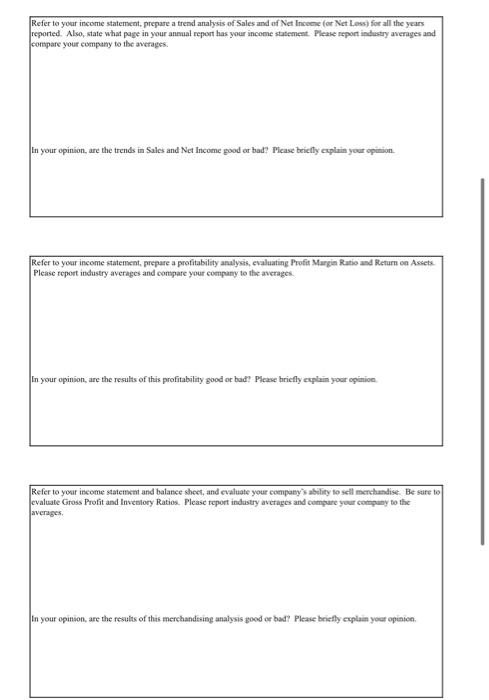
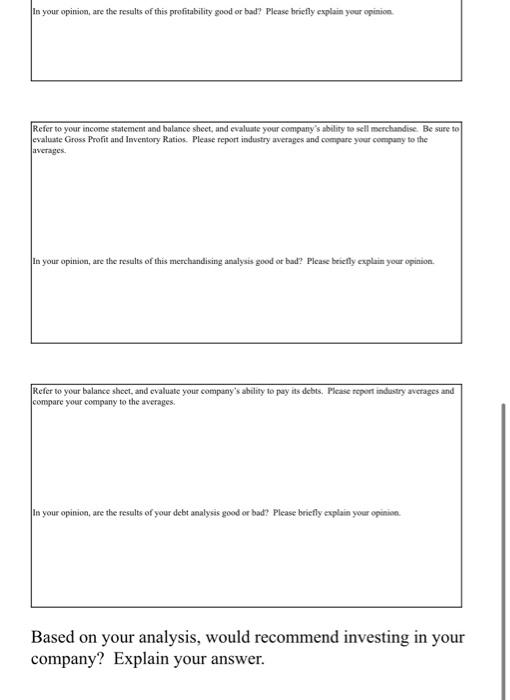
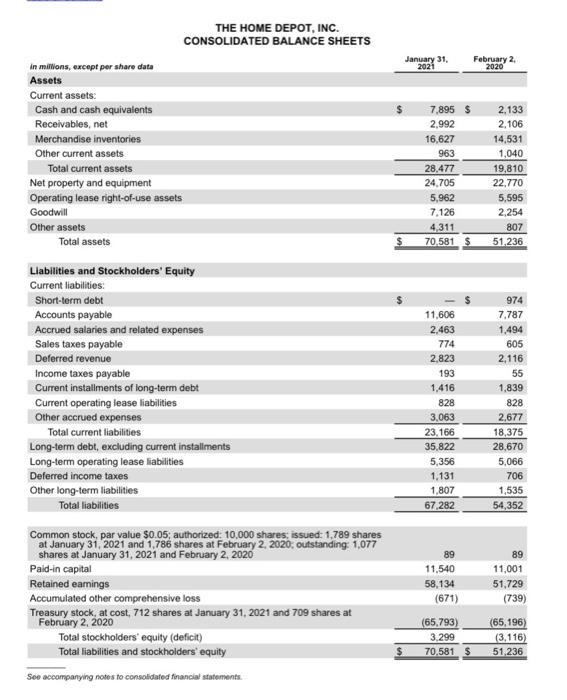
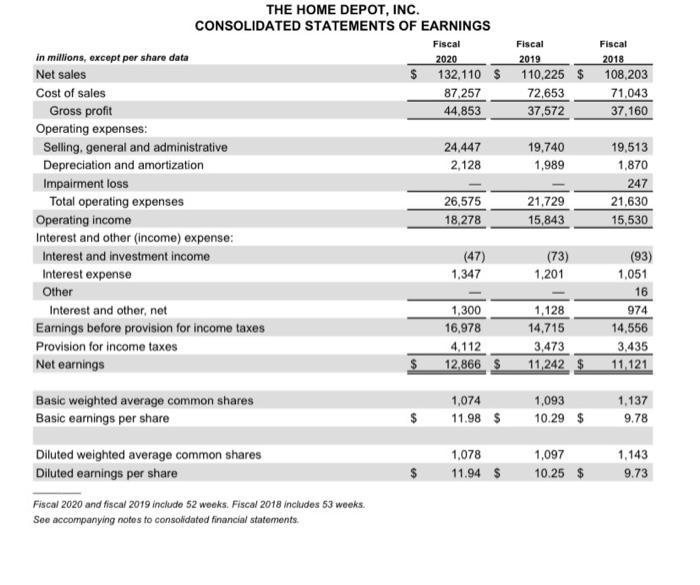
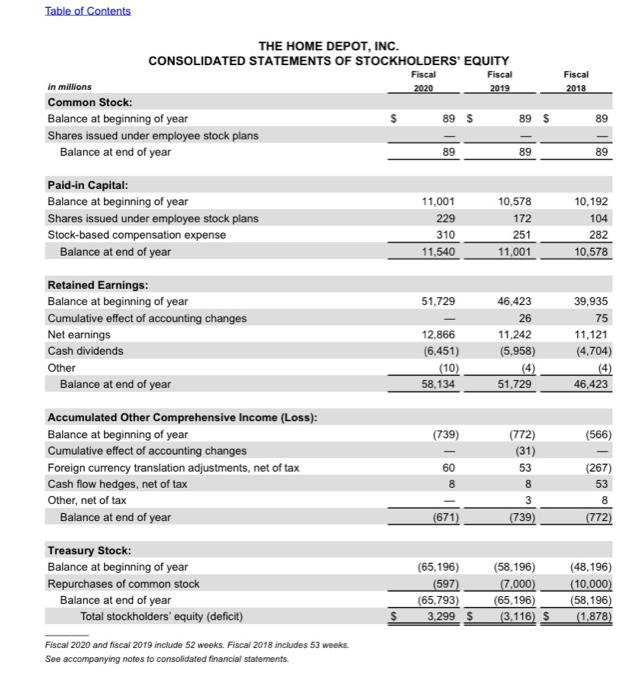
In this project, you will assess the financial health of a publicly-traded merchandising business and, using financial analysis tools in your textbook, decide whether to invest in the stock of the company. Include the following sections in your analysis, and fully explain your final decision. Include detailed calculations 1. Trend analysis for net sales and net income 2. Profitability analysis 3. Evaluation of the ability to sell merchandise inventory 4. Evaluation of the ability to pay debts Each section should include a table with financial information and the necessary ratio calculations to analyze that area of the company. After each table, provide approximately one paragraph of analysis. The analysis should include a comparison to industry averages for your company. Conclude the report with your final decision (invest or not invest), incorporating the information and analyses from each section. Resources availableeeded include, but are not limited to: Balance sheet and income statement for your chosen company (most recent annual report) ProfitCents - for industry comparison Textbook Submit your project in a Word document/PDF on Canvas. Include the following documentation with your analysis: Copy of all balance sheets and income statements used Copy of industry information used from Profitcents *Company should be at least 70% merchandising Please Note: This assignment may be used to evaluate Analytical & Problem Solving Skills for the College of Business & Management's Assurance of Learning process. All student information is removed from the submission when used in this manner. Evaluation of the submission for this purpose is based on the rubric provided below. This rubric may differ from the grading criteria used by your instructor but should be considered as you complete the assignment. College of Business & Management Undergraduate Learning Goal #2 Our Students will Demonstrate Analytical & Problem Solving Skills Objective: Students will correctly identify a problem, critically analyze the problem with appropriate techniques, and develop a solution. Problem Identification Clearly defines the problem in actionable terms Outlines the necessary objectives Clearly identifies symptoms of the problem Application of Appropriate Analytical Techniques Identifies relevant information needed to analyze the problem Selects appropriate analysis technique(s) Clearly and concisely describes problem solving/analysis Considers relevant constraints of the problem situation Applies analysis techniques appropriately/correctly Solution Development Pros and cons of alternative actions clearly presented Solution and all relevant work is correct Clearly and concisely describes results and conclusions Appropriate and logical interpretation of results Provided recommendations consistent with results Assurance of learning refers to the processes for demonstrating that students achieve learning expectations for the programs in which they participate Schools use assurance of learning to demonstrate accountability and assure external constituents such as potential students, trustees, public officials, supporters, and accrediting organizations that the school meets its goals. Assurance of learning also assists the school and faculty members to improve programs and courses.. (Definition from AACSB Eligibility Procedures and Accreditation Standards for Business Accreditation) What is the name of the business you are reporting on? Based on financial performance ratios covered in the course, how will you go about determining whether you would recommend investing in the business? Please describe the decision that you face in this project. Refer to your income statement, prepare a profitabdity analysis, evaluating Profit Margin Ratio and Return on Assets Please report industry averages and compare your company to the averages in your opinion, are the results of this profitability prodot hal? Please briefly explain your opinion Table of Contents THE HOME DEPOT, INC. CONSOLIDATED STATEMENTS OF EARNINGS Fiscal Fiscal Fiscal in millions, except per share data 2020 2019 2018 Net sales $ 132,110 $ 110,225 $ 108,203 Cost of sales 87,257 72,653 71,043 Gross profit 44,853 37,572 37,160 Operating expenses: Selling, general and administrative 24,447 19,740 19,513 Depreciation and amortization 2,128 1,989 1,870 Impairment loss 247 Total operating expenses 26,575 21,729 21,630 Operating income 18,278 15,843 15,530 Interest and other (income) expense: Interest and investment income (47) (73) (93) Interest expense 1,347 1,201 1,051 Other 16 Interest and other, net 1,300 1,128 974 Earnings before provision for income taxes 16,978 14,715 14,556 Provision for income taxes 4,112 3,473 3,435 Net earnings 12,866 $ 11,242 $ 11.121 Basic weighted average common shares Basic earnings per share 1,074 11.98 $ 1,093 10.29 $ 1,137 9.78 $ 1,078 11.94 $ 1,097 10.25 $ 1,143 9.73 Diluted weighted average common shares Diluted earnings per share Fiscal 2020 and fiscal 2019 include 52 weeks. Fiscal 2018 includes 53 weeks. See accompanying notes to consolidated financial statements. January 31, 2021 February 2 2020 THE HOME DEPOT, INC. CONSOLIDATED BALANCE SHEETS in millions, except per share data Assets Current assets: Cash and cash equivalents Receivables, net Merchandise inventories Other current assets Total current assets Net property and equipment Operating lease right-of-use assets Goodwill Other assets Total assets 7,895 $ 2.992 16,627 963 28,477 24,705 5,962 7.126 4,311 70,581 $ 2,133 2,106 14,531 1,040 19,810 22.770 5,595 2 254 807 51 236 Liabilities and Stockholders' Equity Current liabilities: Short-term debt Accounts payable Accrued salaries and related expenses Sales taxes payable Deferred revenue Income taxes payable Current installments of long-term debt Current operating lease liabilities Other accrued expenses Total current liabilities Long-term debt, excluding current installments Long-term operating lease liabilities Deferred income taxes Other long-term liabilities Total liabilities 11,606 2.463 774 2,823 193 1,416 828 3,063 23.166 35,822 5,356 1,131 1,807 67.282 974 7.787 1,494 605 2.116 55 1,839 828 2,677 18.375 28,670 5,066 706 1,535 54,352 89 11,540 58.134 (671) 89 11,001 51,729 (739) Common stock, par value $0.05, authorized: 10,000 shares, issued: 1,789 shares at January 31, 2021 and 1,786 shares at February 2, 2020; outstanding: 1,077 shares at January 31, 2021 and February 2, 2020 Paid-in capital Retained earnings Accumulated other comprehensive loss Treasury stock, at cost, 712 shares at January 31, 2021 and 709 shares at February 2, 2020 Total stockholders' equity (deficit) Total liabilities and stockholders' equity See accompanying notes to consolidated Financial statements (65.793) 3.299 70,581 $ (65.196) (3.116) 51.236 $ In this project, you will assess the financial health of a publicly-traded merchandising business and, using financial analysis tools in your textbook, decide whether to invest in the stock of the company. Include the following sections in your analysis, and fully explain your final decision. Include detailed calculations. 1. Trend analysis for net sales and net income 2. Profitability analysis 3. Evaluation of the ability to sell merchandise inventory 4. Evaluation of the ability to pay debts Each section should include a table with financial information and the necessary ratio calculations to analyze that area of the company. After each table, provide approximately one paragraph of analysis. The analysis should include a comparison to industry averages for your company. Conclude the report with your final decision (invest or not invest), incorporating the information and analyses from each section. Resources availableeeded include, but are not limited to: Balance sheet and income statement for your chosen company (most recent annual report) ProfitCents - for industry comparison Textbook Submit your project in a Word document/PDF on Canvas. Include the following documentation with your analysis: Copy of all balance sheets and income statements used Copy of industry information used from ProfitCents *Company should be at least 70% merchandising Please Note: This assignment may be used to evaluate Analytical & Problem Solving Skills for the College of Business & Management's Assurance of Learning process. All student information is removed from the submission when used in this manner. Evaluation of the submission for this purpose is based on the rubric provided below. This rubric may differ from the grading criteria used by your instructor but should be considered as you complete the assignment. College of Business & Management Undergraduate Learning Goal #2 Our Students will Demonstrate Analytical & Problem Solving skills Objective: Students will correctly identify a problem, critically analyze the problem with appropriate techniques, and develop a solution Problem Identification Clearly defines the problem in actionable terms Outlines the necessary objectives Clearly identifies symptoms of the problem Application of Appropriate Analytical Techniques Identifies relevant information needed to analyze the problem Selects appropriate analysis technique(s) Clearly and concisely describes problem solving/analysis Considers relevant constraints of the problem situation Applies analysis techniques appropriately/correctly Solution Development Pros and cons of alternative actions clearly presented Solution and all relevant work is correct Clearly and concisely describes results and conclusions Appropriate and logical interpretation of results Provided recommendations consistent with results *Assurance of learning refers to the processes for demonstrating that students achieve learning expectations for the programs in which they participate. Schools use assurance of learning to demonstrate accountability and assure external constituents such as potential students, trustees, public officials, supporters, and accrediting organizations that the school meets its goals. Assurance of learning also assists the school and faculty members to improve programs and courses... (Definition from AACSB Eligibility Procedures and Accreditation Standards for Business Accreditation) What is the name of the business you are reporting on? Based on financial performance ratios covered in the course, how will you go about determining whether you would recommend investing in the business? Please describe the decision that you face in this project. Refer to your income statement, prepare a trend analysis of Sales and of Net Income (or Net Loss) for all the years reported. Also, state what page in your annual report has your income statement. Please report industry averages and compare your company to the averages in your opinion, are the trends in Sales and Net Income good or bad? Please briefly explain your opinion Refer to your income statement, prepare a profitability analysis, evaluating Profit Margin Ratio and Return on Assets Please report industry averages and compare your company to the averages in your opinion, are the results of this profitability good or bad? Please briefly explain your opinion Refer to your income statement and balance sheet, and evaluate your company's ability to sell merchandise. Be sure to evaluate Gross Profit and Inventory Ratios. Please report industry averages and compare your company to the averages in your opinion, are the results of this merchandising analysis good or bad? Please briefly explain your opinion, in your opinion, are the results of this profitability good or bad? Please briefly explain your opinion Refer to your income statement and balance sheet, and evaluate your company's ability to sell merchandise. Be sure to evaluate Gross Profit and Inventory Ratios. Please report industry averages and compare your company to the averages. in your opinion, are the results of this merchandising analysis good or bad? Please beietly explain your opinion. Refer to your balance sheet, and evaluate your company's ability to pay its debts. Please report industry averages and compare your company to the averages in your opinion, are the results of your debt analysis good or bad? Please briefly explain your opinion Based on your analysis, would recommend investing in your company? Explain your answer. January 31, 2021 February 2 2020 7,895 $ 2,992 16,627 963 28,477 24.705 5,962 7,126 4,311 70,581 $ 2.133 2,106 14,531 1,040 19,810 22.770 5,595 2,254 807 51.236 $ THE HOME DEPOT, INC. CONSOLIDATED BALANCE SHEETS in millions, except por share data Assets Current assets: Cash and cash equivalents Receivables, net Merchandise inventories Other current assets Total current assets Net property and equipment Operating lease right-of-use assets Goodwill Other assets Total assets Liabilities and Stockholders' Equity Current liabilities Short-term debt Accounts payable Accrued salaries and related expenses Sales taxes payable Deferred revenue Income taxes payable Current installments of long-term debt Current operating lease liabilities Other accrued expenses Total current liabilities Long-term debt, excluding current installments Long-term operating lease liabilities Deferred income taxes Other long-term liabilities Total liabilities Common stock, par value $0.05; authorized: 10.000 shares; issued: 1,789 shares at January 31, 2021 and 1,786 shares at February 2, 2020, outstanding: 1.077 shares at January 31, 2021 and February 2.2020 Paid-in capital Retained earnings Accumulated other comprehensive loss Treasury stock, at cost, 712 shares at January 31, 2021 and 709 shares at February 2, 2020 Total stockholders' equity (deficit) Total liabilities and stockholders' equity See accompanying notes to consolidated financial statements 11,606 2,463 774 2,823 193 1,416 828 3,063 23.166 35.822 5,356 1.131 1,807 67,282 974 7.787 1,494 605 2,116 55 1,839 828 2,677 18,375 28,670 5,066 706 1,535 54,352 89 11.540 58,134 (671) 89 11,001 51,729 (739) (65.793) 3.299 70.581 $ (65,196) (3,116) 51,236 $ Fiscal Fiscal 2019 2018 110,225 $ 108,203 72,653 71,043 37,572 37,160 19,740 1,989 THE HOME DEPOT, INC. CONSOLIDATED STATEMENTS OF EARNINGS Fiscal in millions, except per share data 2020 Net sales $ 132,110 $ Cost of sales 87,257 Gross profit 44,853 Operating expenses: Selling, general and administrative 24,447 Depreciation and amortization 2,128 Impairment loss Total operating expenses 26,575 Operating income 18,278 Interest and other (income) expense: Interest and investment income (47) Interest expense 1,347 Other Interest and other, net 1,300 Earnings before provision for income taxes 16,978 Provision for income taxes 4,112 Net earnings 12.866 $ 19,513 1,870 247 21,630 15,530 21,729 15,843 (73) 1,201 1.128 14,715 3,473 11,242 $ (93) 1,051 16 974 14,556 3,435 11.121 Basic weighted average common shares Basic earnings per share 1,074 11.98 $ 1,093 10.29 $ 1,137 9.78 Diluted weighted average common shares Diluted earnings per share 1,078 11.94 $ 1,097 10.25 $ 1.143 9.73 Fiscal 2020 and fiscal 2019 include 52 weeks. Fiscal 2018 includes 53 weeks. See accompanying notes to consolidated financial statements. Table of Contents THE HOME DEPOT, INC. CONSOLIDATED STATEMENTS OF STOCKHOLDERS' EQUITY Fiscal 2020 Fiscal 2019 Fiscal 2018 in millions Common Stock: Balance at beginning of year Shares issued under employee stock plans Balance at end of year 89 $ 89 $ 89 89 89 89 Paid-in Capital: Balance at beginning of year Shares issued under employee stock plans Stock-based compensation expense Balance at end of year 10,192 104 11,001 229 310 11.540 10,578 172 251 11,001 282 10.578 51.729 Retained Earnings: Balance at beginning of year Cumulative effect of accounting changes Net earnings Cash dividends Other Balance at end of year 12.866 (6,451) (10) 58,134 46,423 26 11,242 (5,958) 39,935 75 11.121 (4,704) 51,729 46,423 (739) (566) Accumulated Other Comprehensive Income (Loss): Balance at beginning of year Cumulative effect of accounting changes Foreign currency translation adjustments, net of tax Cash flow hedges, net of tax Other, net of tax Balance at end of year 60 8 (772) (31) 53 8 3 (739) (267) 53 8 (671) (772) Treasury Stock: Balance at beginning of year Repurchases of common stock Balance at end of year Total stockholders' equity (deficit) Fiscal 2020 and fiscal 2019 include 52 weeks. Fiscal 2018 includes 53 weeks See accompanying notes to consolidated financial statements (65,196) (597) (65,793) 3.299 $ (58,196) (7,000 (65.196) (3.116) $ (48,196) (10,000) (58,196) (1.878) In this project, you will assess the financial health of a publicly-traded merchandising business and, using financial analysis tools in your textbook, decide whether to invest in the stock of the company. Include the following sections in your analysis, and fully explain your final decision. Include detailed calculations 1. Trend analysis for net sales and net income 2. Profitability analysis 3. Evaluation of the ability to sell merchandise inventory 4. Evaluation of the ability to pay debts Each section should include a table with financial information and the necessary ratio calculations to analyze that area of the company. After each table, provide approximately one paragraph of analysis. The analysis should include a comparison to industry averages for your company. Conclude the report with your final decision (invest or not invest), incorporating the information and analyses from each section. Resources availableeeded include, but are not limited to: Balance sheet and income statement for your chosen company (most recent annual report) ProfitCents - for industry comparison Textbook Submit your project in a Word document/PDF on Canvas. Include the following documentation with your analysis: Copy of all balance sheets and income statements used Copy of industry information used from Profitcents *Company should be at least 70% merchandising Please Note: This assignment may be used to evaluate Analytical & Problem Solving Skills for the College of Business & Management's Assurance of Learning process. All student information is removed from the submission when used in this manner. Evaluation of the submission for this purpose is based on the rubric provided below. This rubric may differ from the grading criteria used by your instructor but should be considered as you complete the assignment. College of Business & Management Undergraduate Learning Goal #2 Our Students will Demonstrate Analytical & Problem Solving Skills Objective: Students will correctly identify a problem, critically analyze the problem with appropriate techniques, and develop a solution. Problem Identification Clearly defines the problem in actionable terms Outlines the necessary objectives Clearly identifies symptoms of the problem Application of Appropriate Analytical Techniques Identifies relevant information needed to analyze the problem Selects appropriate analysis technique(s) Clearly and concisely describes problem solving/analysis Considers relevant constraints of the problem situation Applies analysis techniques appropriately/correctly Solution Development Pros and cons of alternative actions clearly presented Solution and all relevant work is correct Clearly and concisely describes results and conclusions Appropriate and logical interpretation of results Provided recommendations consistent with results Assurance of learning refers to the processes for demonstrating that students achieve learning expectations for the programs in which they participate Schools use assurance of learning to demonstrate accountability and assure external constituents such as potential students, trustees, public officials, supporters, and accrediting organizations that the school meets its goals. Assurance of learning also assists the school and faculty members to improve programs and courses.. (Definition from AACSB Eligibility Procedures and Accreditation Standards for Business Accreditation) What is the name of the business you are reporting on? Based on financial performance ratios covered in the course, how will you go about determining whether you would recommend investing in the business? Please describe the decision that you face in this project. Refer to your income statement, prepare a profitabdity analysis, evaluating Profit Margin Ratio and Return on Assets Please report industry averages and compare your company to the averages in your opinion, are the results of this profitability prodot hal? Please briefly explain your opinion Table of Contents THE HOME DEPOT, INC. CONSOLIDATED STATEMENTS OF EARNINGS Fiscal Fiscal Fiscal in millions, except per share data 2020 2019 2018 Net sales $ 132,110 $ 110,225 $ 108,203 Cost of sales 87,257 72,653 71,043 Gross profit 44,853 37,572 37,160 Operating expenses: Selling, general and administrative 24,447 19,740 19,513 Depreciation and amortization 2,128 1,989 1,870 Impairment loss 247 Total operating expenses 26,575 21,729 21,630 Operating income 18,278 15,843 15,530 Interest and other (income) expense: Interest and investment income (47) (73) (93) Interest expense 1,347 1,201 1,051 Other 16 Interest and other, net 1,300 1,128 974 Earnings before provision for income taxes 16,978 14,715 14,556 Provision for income taxes 4,112 3,473 3,435 Net earnings 12,866 $ 11,242 $ 11.121 Basic weighted average common shares Basic earnings per share 1,074 11.98 $ 1,093 10.29 $ 1,137 9.78 $ 1,078 11.94 $ 1,097 10.25 $ 1,143 9.73 Diluted weighted average common shares Diluted earnings per share Fiscal 2020 and fiscal 2019 include 52 weeks. Fiscal 2018 includes 53 weeks. See accompanying notes to consolidated financial statements. January 31, 2021 February 2 2020 THE HOME DEPOT, INC. CONSOLIDATED BALANCE SHEETS in millions, except per share data Assets Current assets: Cash and cash equivalents Receivables, net Merchandise inventories Other current assets Total current assets Net property and equipment Operating lease right-of-use assets Goodwill Other assets Total assets 7,895 $ 2.992 16,627 963 28,477 24,705 5,962 7.126 4,311 70,581 $ 2,133 2,106 14,531 1,040 19,810 22.770 5,595 2 254 807 51 236 Liabilities and Stockholders' Equity Current liabilities: Short-term debt Accounts payable Accrued salaries and related expenses Sales taxes payable Deferred revenue Income taxes payable Current installments of long-term debt Current operating lease liabilities Other accrued expenses Total current liabilities Long-term debt, excluding current installments Long-term operating lease liabilities Deferred income taxes Other long-term liabilities Total liabilities 11,606 2.463 774 2,823 193 1,416 828 3,063 23.166 35,822 5,356 1,131 1,807 67.282 974 7.787 1,494 605 2.116 55 1,839 828 2,677 18.375 28,670 5,066 706 1,535 54,352 89 11,540 58.134 (671) 89 11,001 51,729 (739) Common stock, par value $0.05, authorized: 10,000 shares, issued: 1,789 shares at January 31, 2021 and 1,786 shares at February 2, 2020; outstanding: 1,077 shares at January 31, 2021 and February 2, 2020 Paid-in capital Retained earnings Accumulated other comprehensive loss Treasury stock, at cost, 712 shares at January 31, 2021 and 709 shares at February 2, 2020 Total stockholders' equity (deficit) Total liabilities and stockholders' equity See accompanying notes to consolidated Financial statements (65.793) 3.299 70,581 $ (65.196) (3.116) 51.236 $ In this project, you will assess the financial health of a publicly-traded merchandising business and, using financial analysis tools in your textbook, decide whether to invest in the stock of the company. Include the following sections in your analysis, and fully explain your final decision. Include detailed calculations. 1. Trend analysis for net sales and net income 2. Profitability analysis 3. Evaluation of the ability to sell merchandise inventory 4. Evaluation of the ability to pay debts Each section should include a table with financial information and the necessary ratio calculations to analyze that area of the company. After each table, provide approximately one paragraph of analysis. The analysis should include a comparison to industry averages for your company. Conclude the report with your final decision (invest or not invest), incorporating the information and analyses from each section. Resources availableeeded include, but are not limited to: Balance sheet and income statement for your chosen company (most recent annual report) ProfitCents - for industry comparison Textbook Submit your project in a Word document/PDF on Canvas. Include the following documentation with your analysis: Copy of all balance sheets and income statements used Copy of industry information used from ProfitCents *Company should be at least 70% merchandising Please Note: This assignment may be used to evaluate Analytical & Problem Solving Skills for the College of Business & Management's Assurance of Learning process. All student information is removed from the submission when used in this manner. Evaluation of the submission for this purpose is based on the rubric provided below. This rubric may differ from the grading criteria used by your instructor but should be considered as you complete the assignment. College of Business & Management Undergraduate Learning Goal #2 Our Students will Demonstrate Analytical & Problem Solving skills Objective: Students will correctly identify a problem, critically analyze the problem with appropriate techniques, and develop a solution Problem Identification Clearly defines the problem in actionable terms Outlines the necessary objectives Clearly identifies symptoms of the problem Application of Appropriate Analytical Techniques Identifies relevant information needed to analyze the problem Selects appropriate analysis technique(s) Clearly and concisely describes problem solving/analysis Considers relevant constraints of the problem situation Applies analysis techniques appropriately/correctly Solution Development Pros and cons of alternative actions clearly presented Solution and all relevant work is correct Clearly and concisely describes results and conclusions Appropriate and logical interpretation of results Provided recommendations consistent with results *Assurance of learning refers to the processes for demonstrating that students achieve learning expectations for the programs in which they participate. Schools use assurance of learning to demonstrate accountability and assure external constituents such as potential students, trustees, public officials, supporters, and accrediting organizations that the school meets its goals. Assurance of learning also assists the school and faculty members to improve programs and courses... (Definition from AACSB Eligibility Procedures and Accreditation Standards for Business Accreditation) What is the name of the business you are reporting on? Based on financial performance ratios covered in the course, how will you go about determining whether you would recommend investing in the business? Please describe the decision that you face in this project. Refer to your income statement, prepare a trend analysis of Sales and of Net Income (or Net Loss) for all the years reported. Also, state what page in your annual report has your income statement. Please report industry averages and compare your company to the averages in your opinion, are the trends in Sales and Net Income good or bad? Please briefly explain your opinion Refer to your income statement, prepare a profitability analysis, evaluating Profit Margin Ratio and Return on Assets Please report industry averages and compare your company to the averages in your opinion, are the results of this profitability good or bad? Please briefly explain your opinion Refer to your income statement and balance sheet, and evaluate your company's ability to sell merchandise. Be sure to evaluate Gross Profit and Inventory Ratios. Please report industry averages and compare your company to the averages in your opinion, are the results of this merchandising analysis good or bad? Please briefly explain your opinion, in your opinion, are the results of this profitability good or bad? Please briefly explain your opinion Refer to your income statement and balance sheet, and evaluate your company's ability to sell merchandise. Be sure to evaluate Gross Profit and Inventory Ratios. Please report industry averages and compare your company to the averages. in your opinion, are the results of this merchandising analysis good or bad? Please beietly explain your opinion. Refer to your balance sheet, and evaluate your company's ability to pay its debts. Please report industry averages and compare your company to the averages in your opinion, are the results of your debt analysis good or bad? Please briefly explain your opinion Based on your analysis, would recommend investing in your company? Explain your answer. January 31, 2021 February 2 2020 7,895 $ 2,992 16,627 963 28,477 24.705 5,962 7,126 4,311 70,581 $ 2.133 2,106 14,531 1,040 19,810 22.770 5,595 2,254 807 51.236 $ THE HOME DEPOT, INC. CONSOLIDATED BALANCE SHEETS in millions, except por share data Assets Current assets: Cash and cash equivalents Receivables, net Merchandise inventories Other current assets Total current assets Net property and equipment Operating lease right-of-use assets Goodwill Other assets Total assets Liabilities and Stockholders' Equity Current liabilities Short-term debt Accounts payable Accrued salaries and related expenses Sales taxes payable Deferred revenue Income taxes payable Current installments of long-term debt Current operating lease liabilities Other accrued expenses Total current liabilities Long-term debt, excluding current installments Long-term operating lease liabilities Deferred income taxes Other long-term liabilities Total liabilities Common stock, par value $0.05; authorized: 10.000 shares; issued: 1,789 shares at January 31, 2021 and 1,786 shares at February 2, 2020, outstanding: 1.077 shares at January 31, 2021 and February 2.2020 Paid-in capital Retained earnings Accumulated other comprehensive loss Treasury stock, at cost, 712 shares at January 31, 2021 and 709 shares at February 2, 2020 Total stockholders' equity (deficit) Total liabilities and stockholders' equity See accompanying notes to consolidated financial statements 11,606 2,463 774 2,823 193 1,416 828 3,063 23.166 35.822 5,356 1.131 1,807 67,282 974 7.787 1,494 605 2,116 55 1,839 828 2,677 18,375 28,670 5,066 706 1,535 54,352 89 11.540 58,134 (671) 89 11,001 51,729 (739) (65.793) 3.299 70.581 $ (65,196) (3,116) 51,236 $ Fiscal Fiscal 2019 2018 110,225 $ 108,203 72,653 71,043 37,572 37,160 19,740 1,989 THE HOME DEPOT, INC. CONSOLIDATED STATEMENTS OF EARNINGS Fiscal in millions, except per share data 2020 Net sales $ 132,110 $ Cost of sales 87,257 Gross profit 44,853 Operating expenses: Selling, general and administrative 24,447 Depreciation and amortization 2,128 Impairment loss Total operating expenses 26,575 Operating income 18,278 Interest and other (income) expense: Interest and investment income (47) Interest expense 1,347 Other Interest and other, net 1,300 Earnings before provision for income taxes 16,978 Provision for income taxes 4,112 Net earnings 12.866 $ 19,513 1,870 247 21,630 15,530 21,729 15,843 (73) 1,201 1.128 14,715 3,473 11,242 $ (93) 1,051 16 974 14,556 3,435 11.121 Basic weighted average common shares Basic earnings per share 1,074 11.98 $ 1,093 10.29 $ 1,137 9.78 Diluted weighted average common shares Diluted earnings per share 1,078 11.94 $ 1,097 10.25 $ 1.143 9.73 Fiscal 2020 and fiscal 2019 include 52 weeks. Fiscal 2018 includes 53 weeks. See accompanying notes to consolidated financial statements. Table of Contents THE HOME DEPOT, INC. CONSOLIDATED STATEMENTS OF STOCKHOLDERS' EQUITY Fiscal 2020 Fiscal 2019 Fiscal 2018 in millions Common Stock: Balance at beginning of year Shares issued under employee stock plans Balance at end of year 89 $ 89 $ 89 89 89 89 Paid-in Capital: Balance at beginning of year Shares issued under employee stock plans Stock-based compensation expense Balance at end of year 10,192 104 11,001 229 310 11.540 10,578 172 251 11,001 282 10.578 51.729 Retained Earnings: Balance at beginning of year Cumulative effect of accounting changes Net earnings Cash dividends Other Balance at end of year 12.866 (6,451) (10) 58,134 46,423 26 11,242 (5,958) 39,935 75 11.121 (4,704) 51,729 46,423 (739) (566) Accumulated Other Comprehensive Income (Loss): Balance at beginning of year Cumulative effect of accounting changes Foreign currency translation adjustments, net of tax Cash flow hedges, net of tax Other, net of tax Balance at end of year 60 8 (772) (31) 53 8 3 (739) (267) 53 8 (671) (772) Treasury Stock: Balance at beginning of year Repurchases of common stock Balance at end of year Total stockholders' equity (deficit) Fiscal 2020 and fiscal 2019 include 52 weeks. Fiscal 2018 includes 53 weeks See accompanying notes to consolidated financial statements (65,196) (597) (65,793) 3.299 $ (58,196) (7,000 (65.196) (3.116) $ (48,196) (10,000) (58,196) (1.878)