

Question
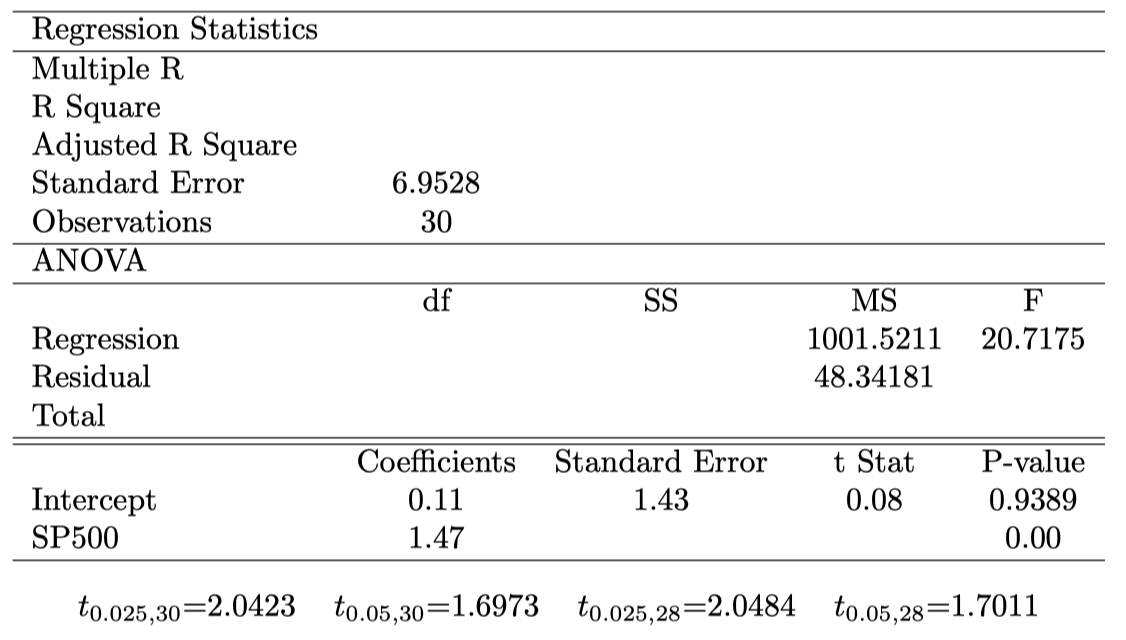
The regression below shows the estimated relationship between the market return (S&P 500) and the return of the company Amerox. Here is your partial Excel
The regression below shows the estimated relationship between the market return (S&P 500) and the return of the company Amerox. Here is your partial Excel output along with some t distribution critical values:
Step by Step Solution
There are 3 Steps involved in it
Step: 1

Get Instant Access to Expert-Tailored Solutions
See step-by-step solutions with expert insights and AI powered tools for academic success
Step: 2

Step: 3
Ace Your Homework with AI
Get the answers you need in no time with our AI-driven, step-by-step assistance
Get Started
International economics
Authors: Robert J. Carbaugh
13th Edition
978-1439038949, 1439038945, 978-8131518823