

Answered step by step
Verified Expert Solution
Question
1 Approved Answer
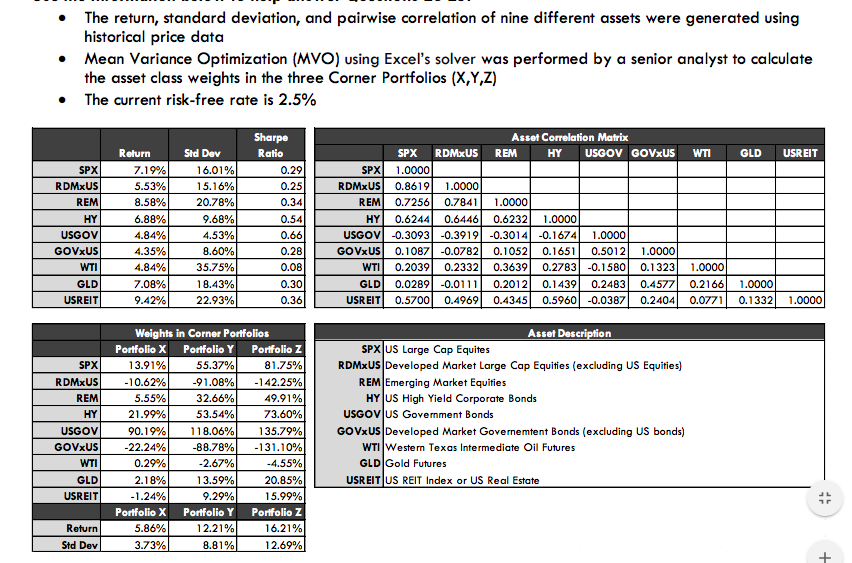
The return, standard deviation, and pairwise correlation of nine different assets were generated using historical price data Mean Variance Optimization (MVO) using Excel's solver was
Step by Step Solution
There are 3 Steps involved in it
Step: 1

Get Instant Access to Expert-Tailored Solutions
See step-by-step solutions with expert insights and AI powered tools for academic success
Step: 2

Step: 3
Ace Your Homework with AI
Get the answers you need in no time with our AI-driven, step-by-step assistance
Get Started
Options Trading For Beginners
Authors: Mike Hartley
1st Edition
979-8864514832