The screen shot states that total cost for 132,200 swims is $ 995,280, or $7.53 per swim. Suppose you suspect that the cost function is linear and is of the form C(q) =F C+aq, where q denotes the number of swims, FC is the fixed cost and a is the variable cost per swim. Assuming that fixed costs account for70% of total cost for 132,200 swims ,calculate FC and a to estimate the cost function ?
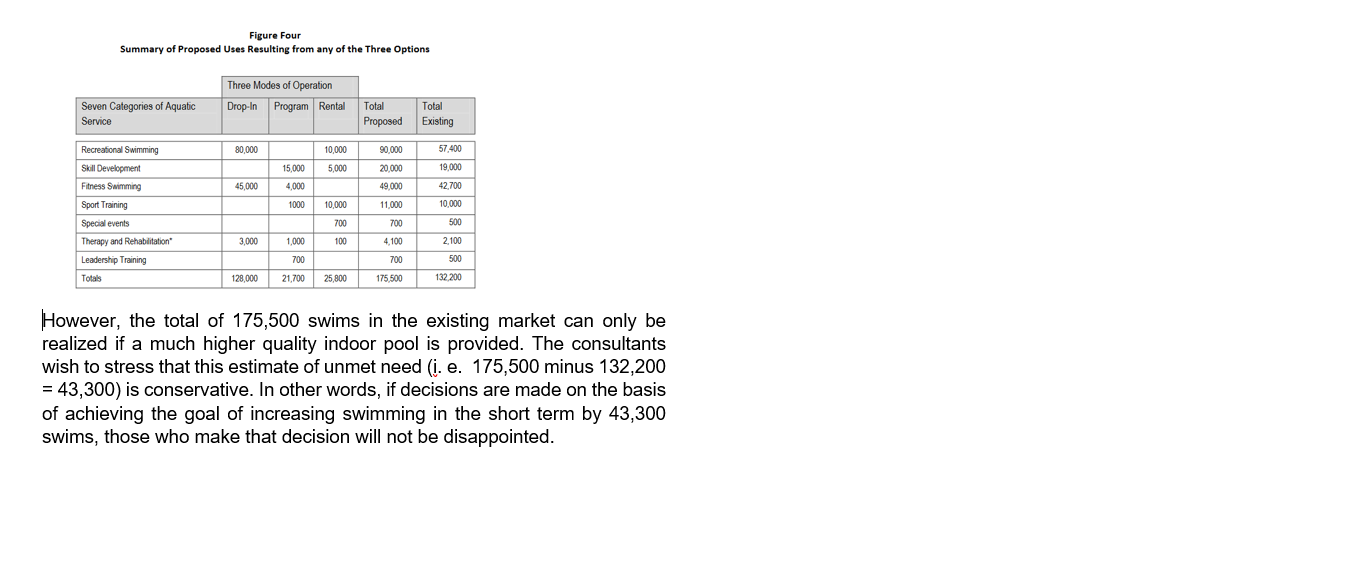
Clipboard Font Paragraph Styles Editing Economics of Pool Operation The consultants then separated the costs and revenues from the dry land fitness activities and calculated the pool costs and revenues y relate to pool uses. The 132,200swimsresulted in user revenue of about $305,443in 2011. That equates to an average of about $2. 31per swim. The total cost of providing those swims is $995,280. That equates to about $7. 53per swim. The recovery rateli. e. the operating revenue expressed as a percentage of operating cost) is 31% and the net subsidy per swim is $5. 22. This cost per swim, revenue per swim, recovery rate, and rate of subsidy are all quite typical in BC. The 3680 sq. fl. main tank of the Sam Ketcham pool has an annual capacity for swimming equal to roughly 174,000 swims. Therefore, the current usage level of 132,200 represents about 76% of capacity. Because almost 70% of pool operating costs are fixed (i. e. it costs about the same per hour to operate a pool with two swimmers as it does to operate a pool with 40 swimmers), and because all pool revenue is variable (i. e. revenue varies directly proportional to total use), a pool which operates close to full capacity almost always has a much higher recovery rate than a pool which operates at a lower proportion of capacity. In other words, if use of the Sam Ketcham pool were to increase from 76% of capacity to, say, 85% of capacity, the additional swims would bring in more revenue than they would add to the operating cost, resulting in a lower operating deficit, and a reduced average deficit per swim. However, the consultants believe that the only way to increase the number of swims in this pool would be to improve the quality of the aquatics experience significantly, and that typically means adding some amenities that will attract the additional users and uses. Adding the attracting amenities will increase capacity and increase operating costs. However, it may not increase operating costs proportionately. In other words, adding new, more attractive, aquatic amenities to increase use may be financially feasible. This will be tested in a subsequent section of this report. Projected Need for Aquatic Service The consultants have found in hundreds of pool planning studies that almost all communities with indoor pools have between 4 and 10 swims per capita per year, and most are in the range of about 6 to 9swims per capita. Where a community sits on that continuum depends almost entirely on the ability of the local pool or pools to meet all seven categories of aquatic needs. Where a pool cannot properly meet all needs in each category, in a high quality way, the community typically scores closer to the bottom of that range. Communities with the highest quality pools are typically in the top half of that range. In Williams Lake the total number of swims equates to about 6. 6swims per capita. The consultants, therefore, believe that there is potential, with an excellent quality indoor pool, to move the swim rate into the 7. 5to 8. 5swims per capita level, an increase of about 20%or more. When the proportions of existing swims are compared to potential swims (from typical communities achieving swim rates of 8to 8. 5swims per capita), it is apparent that the category of swimming which the existing pool is not catering to sufficiently is recreational swimming. There is likely potential to increase this category of swims by 25,000 to 50,000 recreational swims if the pool were to ideally cater to this market. The other categories where there is some significant potential to increase swims include rehabilitation/therapy and fitness swimming. As the local population ages, and swimming is seen as a highly desirable, low injury, efficient form of fitness, there is potential to "grow these two categories substantially by 5,000 to 10,000 between the two categories. Figure Four represents the consultants' best current estimate of future swims in this geographic area, if a new high quality pool can be provided which will continue to meet four categories of swimming, and attract more uses in the remaining three categories of swimming. Page 1 of 2 767 words DE Saving AutoRecovery file Economics of Pool Operation. docc X + 100% Type here to search O W A 90 5:55 PM 7/31/2020Figure Four Summary of Proposed Uses Resulting from any of the Three Options Three Modes of Operation Seven Categories of Aquatic Drop-In Program |Rental Total Total Service Proposed Existing Recreational Swimming 80,000 10,000 90,000 57,400 Skill Development 15,000 5,000 20,00 19,000 Fitness Swimming 45,000 4,000 49,000 42.700 Sport Training 1000 10,000 11,000 10.000 Special events 700 70 50 Therapy and Rehabilitation' 3,000 1,000 100 4.100 2,100 Leadership Training 700 700 500 Totals 128,000 21,700 25,800 175,500 132 200 However, the total of 175,500 swims in the existing market can only be realized if a much higher quality indoor pool is provided. The consultants wish to stress that this estimate of unmet need (i. e. 175,500 minus 132,200 = 43,300) is conservative. In other words, if decisions are made on the basis of achieving the goal of increasing swimming in the short term by 43,300 swims, those who make that decision will not be disappointed