

Answered step by step
Verified Expert Solution
Question
1 Approved Answer
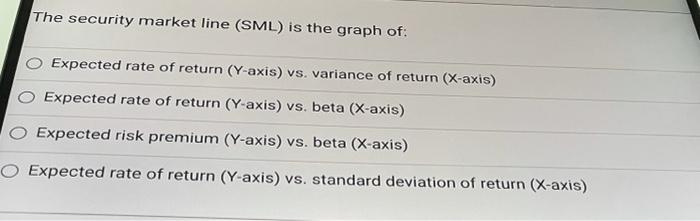
The security market line (SML) is the graph of: Expected rate of return (Y-axis) vs. variance of return (X-axis) Expected rate of return (Y-axis) vs.
Step by Step Solution
There are 3 Steps involved in it
Step: 1

Get Instant Access to Expert-Tailored Solutions
See step-by-step solutions with expert insights and AI powered tools for academic success
Step: 2

Step: 3
Ace Your Homework with AI
Get the answers you need in no time with our AI-driven, step-by-step assistance
Get Started
Understanding The Finance Of Welfare
Authors: Howard Glennerster
2nd Edition
1847421091, 978-1847421098