Answered step by step
Verified Expert Solution
Link Copied!

Question

1 Approved Answer

The solids flux curve shown in Figure Q4 is obtained from a series of batch settling tests for the design [20 marks] of a secondary
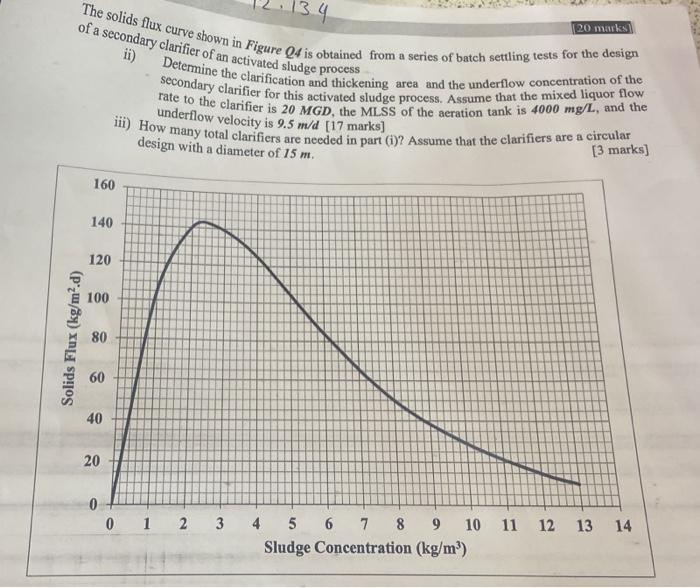
image text in transcribed
The solids flux curve shown in Figure Q4 is obtained from a series of batch settling tests for the design [20 marks] of a secondary clarifier of an activated sludge process ii) Determine the clarification and thickening area and the underflow concentration of the secondary clarifier for this and thickening area and the underflow concentration of the rate to the clarifier is 20MGD, the MLSS of the aeration tank is 4000mg/L, and the underflow iii) How many torf velocity is 9.5m/d [17 marks] design with a diameter of 15m. The solids flux curve shown in Figure Q4 is obtained from a series of batch settling tests for the design [20 marks] of a secondary clarifier of an activated sludge process ii) Determine the clarification and thickening area and the underflow concentration of the secondary clarifier for this and thickening area and the underflow concentration of the rate to the clarifier is 20MGD, the MLSS of the aeration tank is 4000mg/L, and the underflow iii) How many torf velocity is 9.5m/d [17 marks] design with a diameter of 15m

Step by Step Solution

There are 3 Steps involved in it

Step: 1

blur-text-image

Get Instant Access to Expert-Tailored Solutions

See step-by-step solutions with expert insights and AI powered tools for academic success

Step: 2

blur-text-image

Step: 3

blur-text-image

Ace Your Homework with AI

Get the answers you need in no time with our AI-driven, step-by-step assistance

Get Started

Recommended Textbook for

Introduction To Chemical Engineering

Authors: S. Pushpavanam

1st Edition

8120345770, 978-8120345775

More Books

Students also viewed these Chemical Engineering questions

Question

What is your boards committee structure? Is it effective?

Answered: 1 week ago