

Question: The standard normal probability density function is a bell-shaped curve that can be represented as e-22/2 1. 2. 3. Plot this function for values between
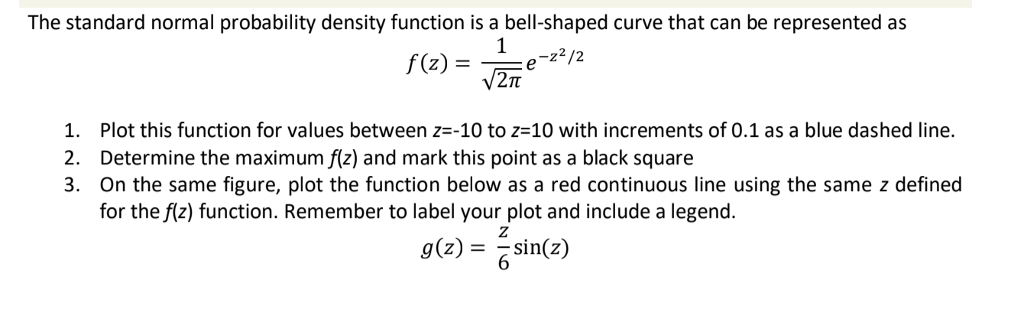
The standard normal probability density function is a bell-shaped curve that can be represented as e-22/2 1. 2. 3. Plot this function for values between z=-10 to z-10 with increments of 0.1 as a blue dashed line. Determine the maximum f(z) and mark this point as a black square On the same figure, plot the function below as a red continuous line using the same z defined for the f(z) function. Remember to label your plot and include a legend. g(z) = sin(z)
Step by Step Solution
There are 3 Steps involved in it
1 Expert Approved Answer
Step: 1 Unlock

Question Has Been Solved by an Expert!
Get step-by-step solutions from verified subject matter experts
Step: 2 Unlock
Step: 3 Unlock