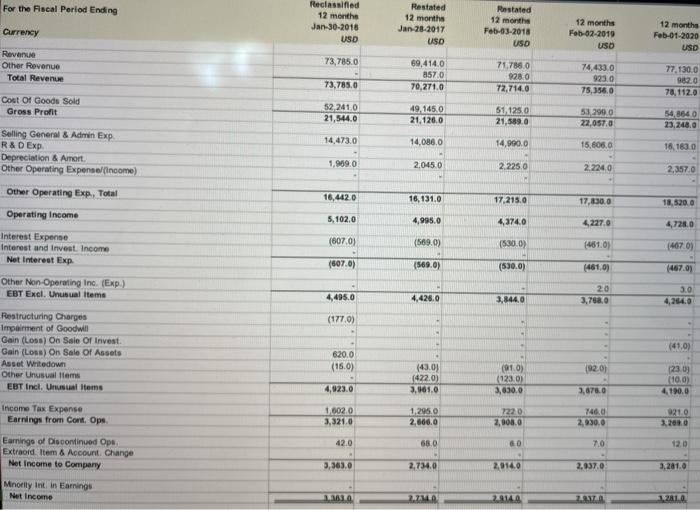
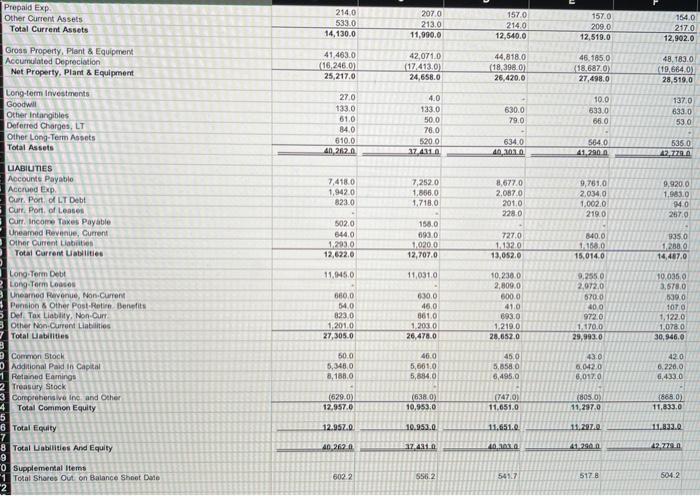
The stock price for Target was $69.56, $63.75, $72.95, $71.17, and $110.74 for fiscal years ending 2016, 2017, 2018, 2019, and 2020, respectively. 7. What was the P/E ratio for the past five years and how would you interpret the trend? That is, what's happening to its perceived value? 8. Using the same stock prices above and using the shares outstanding for each respective year what was the company's market capitalization? Comment on the company's market capitalization trend. What was the Market-to-Book Ratio for the past five years? For the Fiscal Period Ending Reclassified 12 months Jan-30-2016 USD Restated 12 months Jan-28-2017 USD Restated 12 months Feb-03-2018 USD Currency 12 months Feb-02-2019 USD 12 months Feb-01-2020 USD Revenue Other Revenue Total Revenue 73,785.0 69,414.0 857.0 70,271.0 71,7880 928.0 72,714.0 74.433.0 923.0 75,356.0 73,785.0 77,130,0 982.0 78, 112.0 Cost Of Goods Sold Gross Profit 52,241,0 21,544.0 49.145.0 21,126,0 51,1250 21,589.0 53 2990 22,057,0 54,864 0 23, 248.0 14,473.0 14,086.0 14,990.0 15,605.0 Selling General & Admin Exp R&D Exp Depreciation & Amort Other Operating Expense/Income) 18.163.0 1,909.0 2.045.0 2.225.0 2.2240 2,357.0 Other Operating Exp., Total 16,4420 16,131.0 17.215.0 17,830.0 18,520,0 Operating Income 5,102.0 4,995.0 4,374.0 4.227.0 4,7280 Interest Expense Interest and Invest Income Net Interest Exp (607.0) (569.0) (5300) (4610) 4070) (507.0) (569.0) (530.0) (461,0) (467.0) Other Non-Operating Inc. (Exp) EBT Excl. Unusual Items 4,495.0 4,426,0 3,844,0 20 3.783.0 3.0 4,244.0 (1770) - (410) Restructuring Charges Impairment of Goodwill Gain (Loss) On Sale Of Invest. Gain (Loss) On Sale Of Assets Asset Whitedown Other Unusual em EBT Incl. Unusual Items 620.0 (15.0) (920) (43.0) (472.0) 3,961.0 (910) (123.0) 3,650,0 23.0) (10,0) 4.190.0 4,923.0 3,678.0 Income Tax Expense Earnings from Cort Ops 1,602.0 3,321,0 1,295.0 2,660.0 1220 2,9080 746.0 2,930.0 9210 32080 42.0 680 60 7.0 12.0 Earnings of Discontinued Ops Extraord. Item & Account Change Net Income to Company 3,363.0 2,734,0 2,9140 2.9370 3.281.0 Minority int in Earnings Net Income LALO 2.730 20140 ZA 1.2810 Prepaid Exp Other Current Assets Total Current Assets 157.0 2140 5330 14,130.0 2070 213,0 11,990.0 2140 12,540.0 157.0 154.0 209.0 2170 12.519.0 12,902.0 Gross Property, Plant & Equipment Accumulated Depreciation Net Property, Plant & Equipment 41.463.0 (16,246.0) 25,217.0 42,0710 (17413.0) 24,658.0 44,8180 (18.3980) 26,420.0 45.185.0 (18.6870) 27,498.0 48,183.0 (19.664.0) 28,519,0 Long-term Investments Goodwill Other intangibles Deferred Charges, LT Other Long-Term Assets Total Assets 630.0 79.0 27.0 133.0 61.0 84.0 610.0 40, 262.0 4.0 133.0 500 78.0 520.0 37.4110 10.0 5330 65.0 1370 633.0 53.0 634.0 40..1020 5640 41.2000 535.0 42,7720 7,252.0 1.856.0 1,7180 UABIUTIES Accounts Payable Accrued Exp Curr. Port of LT Debt Curr. Port of Leases Curr. Income Taxes Payable Uneamed Revenue, Current Other Ourrent Liabiti Total Current Utilities 8,6770 2.087.0 2010 2280 9,7610 2,0340 1.002.0 2190 9,920.0 1,8810 940 2670 7.4180 1.9420 8230 - 502.0 6440 1,293 0 12,622,0 158.0 093 0 11.0200 12,707.0 7270 11320 13,052.0 840.0 1.1880 15,0140 9350 1.2009 14,487.0 11.5.0 11.031.0 10.230.0 2.800.0 600.0 410 660.0 54.0 8230 1 2010 27,305.0 630.0 46.0 3610 1.2030 26, 478.0 9,255.0 2,072.0 5700 400 972.0 1.170.0 29,993.0 10.0350 3,578,0 530 0 1010 1.1220 1,0780 30,946.0 693.0 1.219.0 28.652.0 500 5,348,0 8,188,0 46.0 5,061.0 5,884,0 Long Term Debt Long Term LOBOS Unearned Revenue, Non.Current Pension & Other Post Retie Benefits 5 Del Tax Liability, Non-Ourt Other Non-Current Liabilities 7 Total Dates 3 Common Stock Additional Paid in Capital 1 Retained Earnings 2 Treasury Stock 3 Comprehensive in and other 4 Total Common Equity 5 6 Total Equity 7 8 Total abilities And Equity 9 Supplemental Items 1 Total Shares Out on Balance Shoot Dale 2 45.0 5.858.0 6,495.0 43.0 6.042.0 6,017.0 42.0 6.220,0 6,433 0 (629.0) 12.957.0 (638) 10,953,0 7470) 11.651.0 (805) 11,2970 (8660) 11,833.0 12.952.0 10.952.0 11.651.0 11.933.0 40.267 12.40 L00110 41.900 42.779 6022 S56.2 5617 5178 504.2 The stock price for Target was $69.56, $63.75, $72.95, $71.17, and $110.74 for fiscal years ending 2016, 2017, 2018, 2019, and 2020, respectively. 7. What was the P/E ratio for the past five years and how would you interpret the trend? That is, what's happening to its perceived value? 8. Using the same stock prices above and using the shares outstanding for each respective year what was the company's market capitalization? Comment on the company's market capitalization trend. What was the Market-to-Book Ratio for the past five years? For the Fiscal Period Ending Reclassified 12 months Jan-30-2016 USD Restated 12 months Jan-28-2017 USD Restated 12 months Feb-03-2018 USD Currency 12 months Feb-02-2019 USD 12 months Feb-01-2020 USD Revenue Other Revenue Total Revenue 73,785.0 69,414.0 857.0 70,271.0 71,7880 928.0 72,714.0 74.433.0 923.0 75,356.0 73,785.0 77,130,0 982.0 78, 112.0 Cost Of Goods Sold Gross Profit 52,241,0 21,544.0 49.145.0 21,126,0 51,1250 21,589.0 53 2990 22,057,0 54,864 0 23, 248.0 14,473.0 14,086.0 14,990.0 15,605.0 Selling General & Admin Exp R&D Exp Depreciation & Amort Other Operating Expense/Income) 18.163.0 1,909.0 2.045.0 2.225.0 2.2240 2,357.0 Other Operating Exp., Total 16,4420 16,131.0 17.215.0 17,830.0 18,520,0 Operating Income 5,102.0 4,995.0 4,374.0 4.227.0 4,7280 Interest Expense Interest and Invest Income Net Interest Exp (607.0) (569.0) (5300) (4610) 4070) (507.0) (569.0) (530.0) (461,0) (467.0) Other Non-Operating Inc. (Exp) EBT Excl. Unusual Items 4,495.0 4,426,0 3,844,0 20 3.783.0 3.0 4,244.0 (1770) - (410) Restructuring Charges Impairment of Goodwill Gain (Loss) On Sale Of Invest. Gain (Loss) On Sale Of Assets Asset Whitedown Other Unusual em EBT Incl. Unusual Items 620.0 (15.0) (920) (43.0) (472.0) 3,961.0 (910) (123.0) 3,650,0 23.0) (10,0) 4.190.0 4,923.0 3,678.0 Income Tax Expense Earnings from Cort Ops 1,602.0 3,321,0 1,295.0 2,660.0 1220 2,9080 746.0 2,930.0 9210 32080 42.0 680 60 7.0 12.0 Earnings of Discontinued Ops Extraord. Item & Account Change Net Income to Company 3,363.0 2,734,0 2,9140 2.9370 3.281.0 Minority int in Earnings Net Income LALO 2.730 20140 ZA 1.2810 Prepaid Exp Other Current Assets Total Current Assets 157.0 2140 5330 14,130.0 2070 213,0 11,990.0 2140 12,540.0 157.0 154.0 209.0 2170 12.519.0 12,902.0 Gross Property, Plant & Equipment Accumulated Depreciation Net Property, Plant & Equipment 41.463.0 (16,246.0) 25,217.0 42,0710 (17413.0) 24,658.0 44,8180 (18.3980) 26,420.0 45.185.0 (18.6870) 27,498.0 48,183.0 (19.664.0) 28,519,0 Long-term Investments Goodwill Other intangibles Deferred Charges, LT Other Long-Term Assets Total Assets 630.0 79.0 27.0 133.0 61.0 84.0 610.0 40, 262.0 4.0 133.0 500 78.0 520.0 37.4110 10.0 5330 65.0 1370 633.0 53.0 634.0 40..1020 5640 41.2000 535.0 42,7720 7,252.0 1.856.0 1,7180 UABIUTIES Accounts Payable Accrued Exp Curr. Port of LT Debt Curr. Port of Leases Curr. Income Taxes Payable Uneamed Revenue, Current Other Ourrent Liabiti Total Current Utilities 8,6770 2.087.0 2010 2280 9,7610 2,0340 1.002.0 2190 9,920.0 1,8810 940 2670 7.4180 1.9420 8230 - 502.0 6440 1,293 0 12,622,0 158.0 093 0 11.0200 12,707.0 7270 11320 13,052.0 840.0 1.1880 15,0140 9350 1.2009 14,487.0 11.5.0 11.031.0 10.230.0 2.800.0 600.0 410 660.0 54.0 8230 1 2010 27,305.0 630.0 46.0 3610 1.2030 26, 478.0 9,255.0 2,072.0 5700 400 972.0 1.170.0 29,993.0 10.0350 3,578,0 530 0 1010 1.1220 1,0780 30,946.0 693.0 1.219.0 28.652.0 500 5,348,0 8,188,0 46.0 5,061.0 5,884,0 Long Term Debt Long Term LOBOS Unearned Revenue, Non.Current Pension & Other Post Retie Benefits 5 Del Tax Liability, Non-Ourt Other Non-Current Liabilities 7 Total Dates 3 Common Stock Additional Paid in Capital 1 Retained Earnings 2 Treasury Stock 3 Comprehensive in and other 4 Total Common Equity 5 6 Total Equity 7 8 Total abilities And Equity 9 Supplemental Items 1 Total Shares Out on Balance Shoot Dale 2 45.0 5.858.0 6,495.0 43.0 6.042.0 6,017.0 42.0 6.220,0 6,433 0 (629.0) 12.957.0 (638) 10,953,0 7470) 11.651.0 (805) 11,2970 (8660) 11,833.0 12.952.0 10.952.0 11.651.0 11.933.0 40.267 12.40 L00110 41.900 42.779 6022 S56.2 5617 5178 504.2