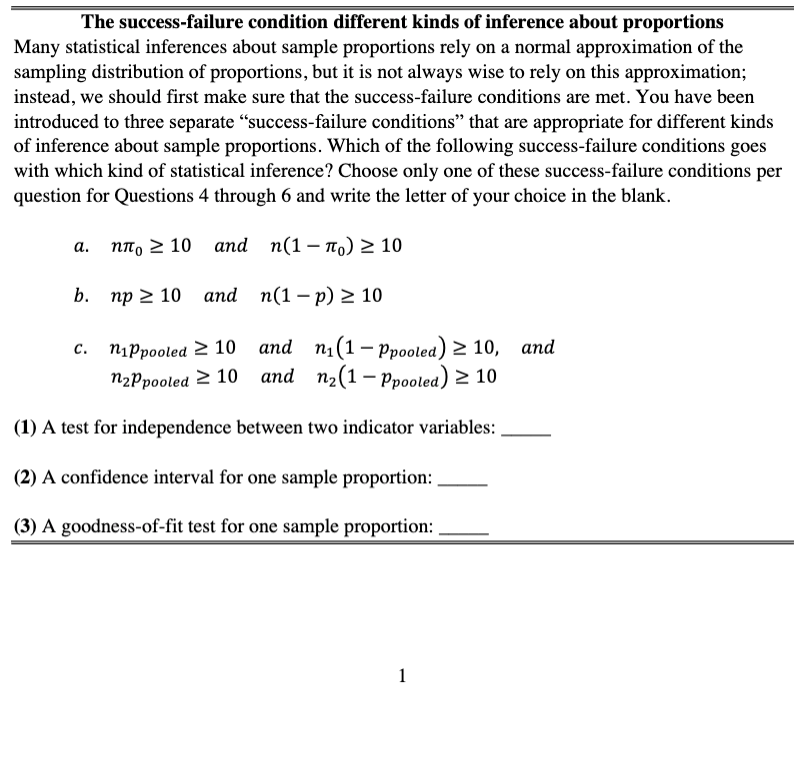
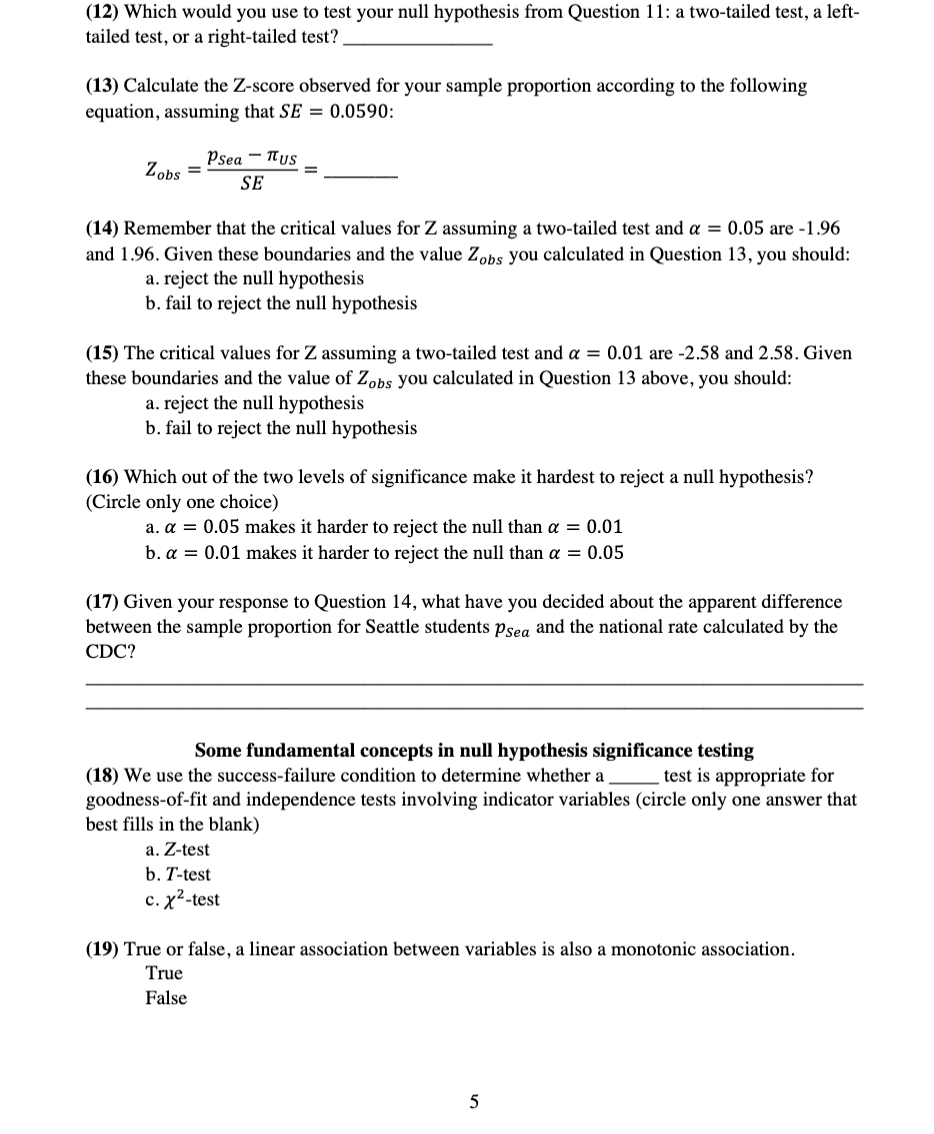
The success-failure condition different kinds of inference about proportionsMany statistical inferences about sample proportions rely on a normal approximation of the sampling distribution of proportions, but it is not always wise to rely on this approximation; instead, we should first make sure that the success-failure conditions are met. You have been introduced to three separate "success-failure conditions" that are appropriate for different kinds of inference about sample proportions. Which of the following success-failure conditions goes with which kind of statistical inference? Choose only one of these success-failure conditions per question for Questions 4 through 6 and write the letter of your choice in the blank.
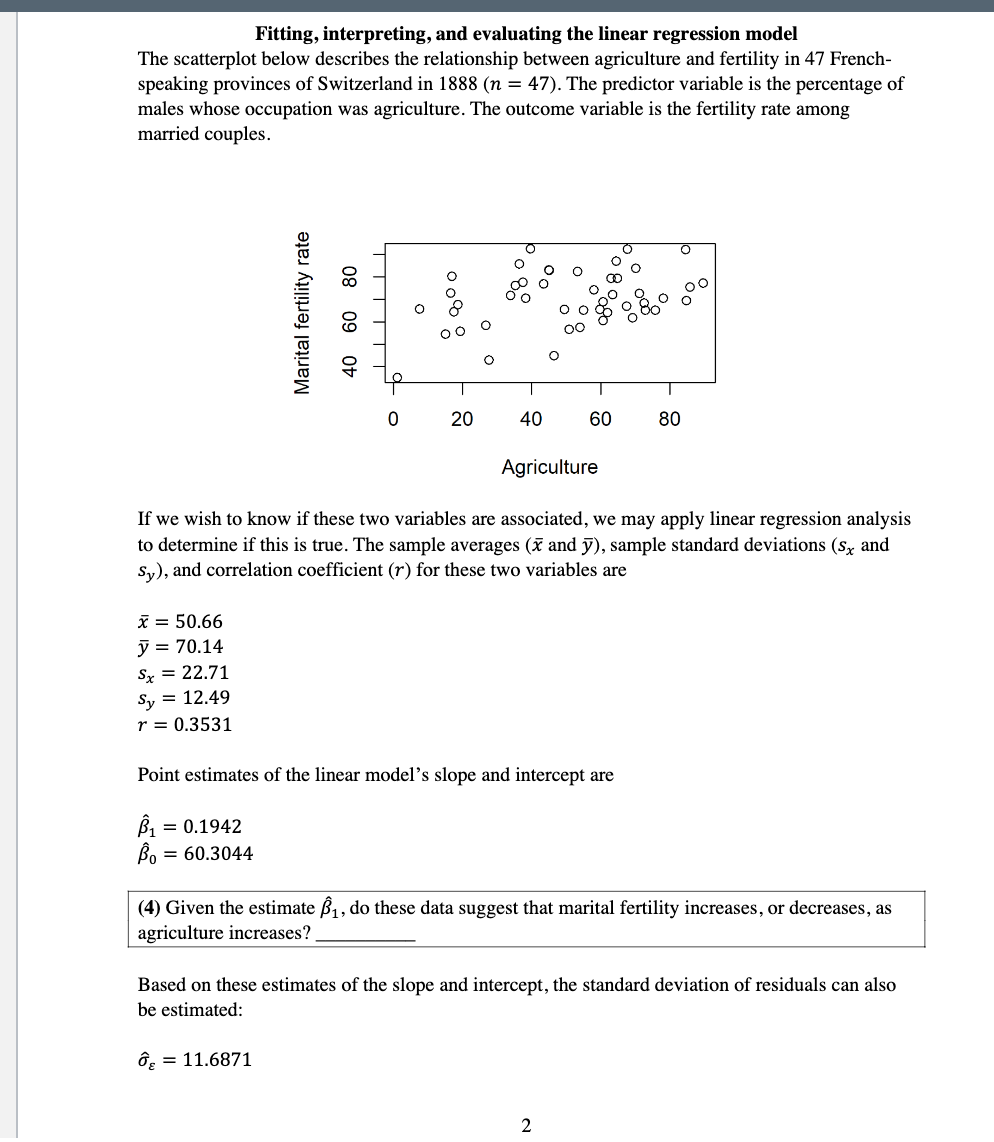
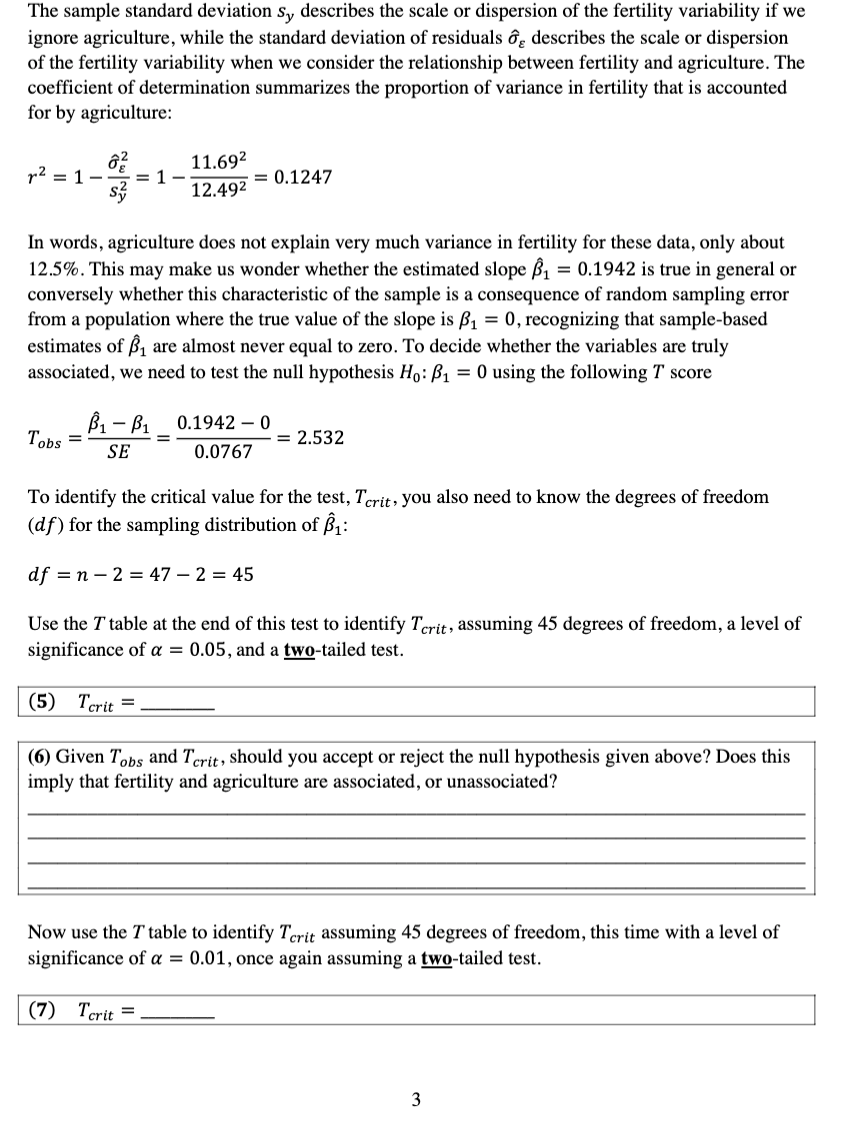
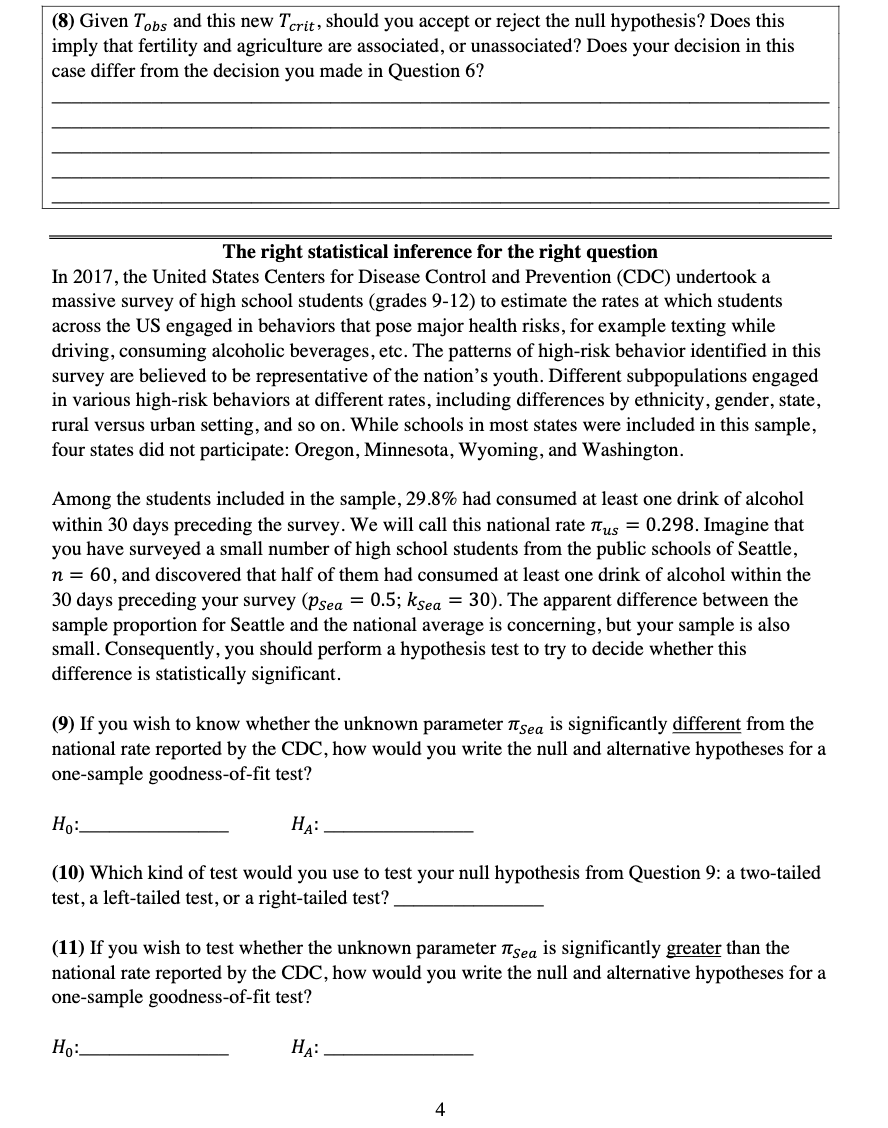
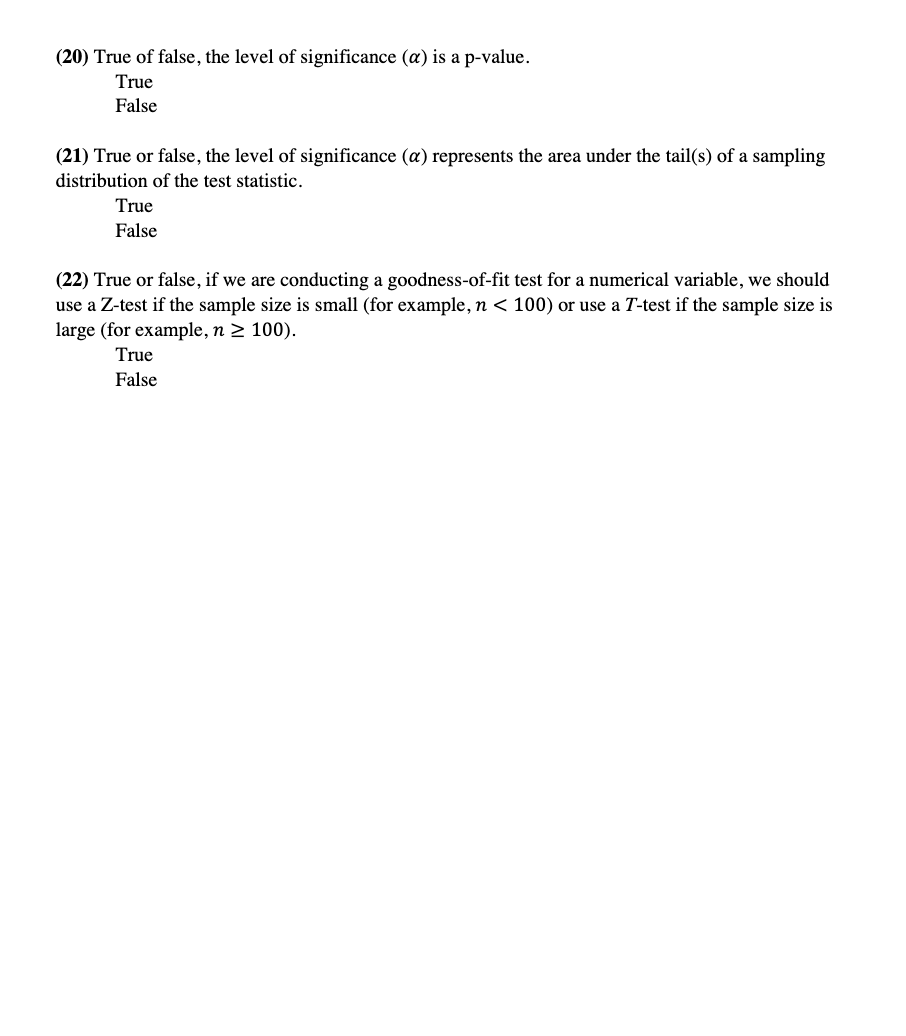
The success-failure condition di'crent kinds of inference about proportions Many statistical inferences about sample proportions rely on a normal approximation of the sampling distribution of proportions, but it is not always wise to rely on this approximation; instead, we should rst make sure that the success-failure conditions are met. You have been introduced to three separate \"success-failure conditions\" that are appropriate for different kinds of inference about sample proportions. Which of the following success-failure conditions goes with which kind of statistical inference? Choose only one of these success-failure conditions per question for Questions 4 through 6 and write the letter of your choice in the blank. 1.1. mm 2 10 and n(1 no) 2 10 13. up 22 10 and n(1 p) 22 10 C. \"Jppogged Z 10 and 111 (1 ppoglgd) 2 10, and nzppoated Z 10 and \"2(1 _ppooted) 2 10 (1) A test for independence between two indicator variables: (2) A condence interval for one sample proportion: (3) A goodness-oft test for one sample proportion: Fitting, interpreting, and evaluating the linear regression model The scatterplot below describes the relationship between agriculture and fertility in 47 French- speaking provinces of Switzerland in 1888 (n = 47). The predictor variable is the percentage of males whose occupation was agriculture. The Outcome variable is the fertility rate among married cOuples. a: '5 0 0o 0 Q\" 8 0 69? 000:: 00 = 0' O O O O O E o o (5) 00%)0080 L" '9 00 0 00 E c c: o 0 a: '=l' E I I I I Agriculture If we wish to know if these two variables are associated, we may apply linear regression analysis to determine if this is true. The sample averages (2': and 37), sample standard deviations (3x and 53,), and correlation coefcient (r) for these two variables are a = 50.00 37 = 70.14 5,. = 22.71 5,, = 12.49 1\" = 0.3531 Point estimates of the linear model's slope and intercept are \"'1 = 0.1942 3., = 60.3044 (4) Given the estimate 31, do these data suggest that marital fertility increases, or decreases, as agriculture increases? Based on these estimates of the slope and intercept, the standard deviation of residuals can also be estimated: as = 11.6871 The sample standard deviation 5,, describes the scale or dispersion of the fertility variability if we ignore agriculture, while the standard deviation of residuals 8,, describes the scale or dispersion of the fertility variability when we consider the relationship between fertility and agriculture. The coefficient of determination summarizes the proportion of variance in fertility that is accounted for by agriculture: 3,2 11.59:2 T2 = 1= 1-m= 0.1247 In words, agriculture does not explain very much variance in fertility for these data, only about 12.5%. This may make us wonder whether the estimated slope 31 = 0.1942 is true in general or conversely whether this characteristic of the sample is a consequence of random sampling error from a population where the true value of the slope is .81 = 0. recognizing that sample-based estimates of 31 are almost never equal to zero. To decide whether the variables are truly associated. we need to test the null hypothesis Ho: [31 = 0 using the following T score 31 51 0.1942 0 Tabs SE W 2.532 To identify the critical value for the test, Twit, you also need to know the degrees of freedom (d f) for the sampling distribution of 3\(8) Given Tabs and this new Twit, should you accept or reject the null hypothesis? Does this imply that fertility and agriculture are associated, or unassociated? Does your decision in this case differ from the decision you made in Question 6? The right statistical inference for the right question In 2017, the United States Centers for Disease Control and Prevention (CDC) undertook a massive survey of high school students (grades 9-12) to estimate the rates at which students across the US engaged in behaviors that pose major health risks, for example testing while driving, consuming alcoholic beverages, etc. The patterns of high-risk behavior identied in this survey are believed to be representative of the nation's youth. Different subpopulations engaged in various high-risk behaviors at different rates, including differences by ethnicity, gender, state, rural versus urban setting, and so on. While schools in most states were included in this sample, four states did not participate: Oregon, Minnesota, Wyoming, and Washington. Among the students included in the sample, 29 3% had consumed at least one drink of alcohol within 30 days preceding the survey. We will call this national rate nus = 0.298. Imagine that you have surveyed a small number of high school students from the public schools of Seattle, 11 = 60, and discovered that half of them had consumed at least one drink of alcohol within the 30 days preceding your survey (p59,, = 0.5; k5,,\" = 30). The apparent difference between the sample proportion for Seattle and the national average is concerning, but your sample is also small. Consequently, you should perform a hypothesis test to try to decide whether this difference is statistically signicant. (9) If you wish to know whether the unknown parameter 11's,,\" is signicantly different from the national rate reported by the CDC, how would you write the null and alternative hypotheses for a one-sample goodness-of-t test? HI]: HA: (10) Which kind of test would you use to test your null hypothesis from Question 9: a two-tailed test, a left-tailed test, or a right-tailed test? (11) ]f you wish to test whether the unknown parameter its\" is signicantly gmater than the national rate reported by the CDC, how w0uld you write the null and alternative hypotheses for a one-sample goodness-of-t test? Ho: HA: (12) Which would you use to test your null hypothesis from Question 11: a two-tailed test, a left- tailed test, or a right-tailed test? (13) Calculate the Zscore observed for your sample proportion according to the following equation. assuming that SE = 0.0590: P5 ' \"us zobs = \"T = (14) Remember that the critical values for Z assuming a two-tailed test and a = 0.05 are -l .96 and 1.96. Given these boundaries and the value Zabs you calculated in Question 13, you should: a. reject the null hypothesis b. fail to reject the null hypothesis (15) The critical values for 2 assuming a two-tailed test and a = 0.01 are -2 .53 and 2.58. Given these boundaries and the value of Z\(20) True of false, the level of significance (a) is a p-value. True False (21) True or false, the level of significance (a) represents the area under the tail(s) of a sampling distribution of the test statistic. True False (22) True or false, if we are conducting a goodness-of-fit test for a numerical variable, we should use a Z-test if the sample size is small (for example, n
