

Answered step by step
Verified Expert Solution
Question
1 Approved Answer
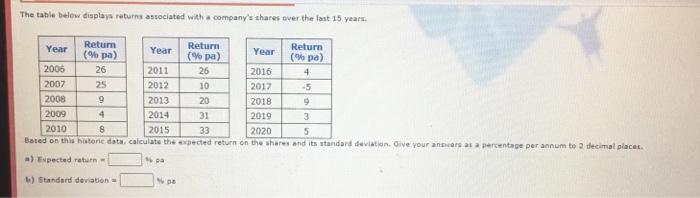
The table below displays returns associated with a company's shares over the last 15 years Year Year Return Return Return (% pa) (% pa) Year
Step by Step Solution
There are 3 Steps involved in it
Step: 1

Get Instant Access to Expert-Tailored Solutions
See step-by-step solutions with expert insights and AI powered tools for academic success
Step: 2

Step: 3
Ace Your Homework with AI
Get the answers you need in no time with our AI-driven, step-by-step assistance
Get Started
Principles of managerial finance
Authors: Lawrence J Gitman, Chad J Zutter
12th edition
9780321524133, 132479540, 321524136, 978-0132479547