Answered step by step
Verified Expert Solution
Link Copied!

Question

1 Approved Answer

The table below gives data on money stock and real and nominal GDP for 2011, and the money stock for 2011 through 2015. Assume that
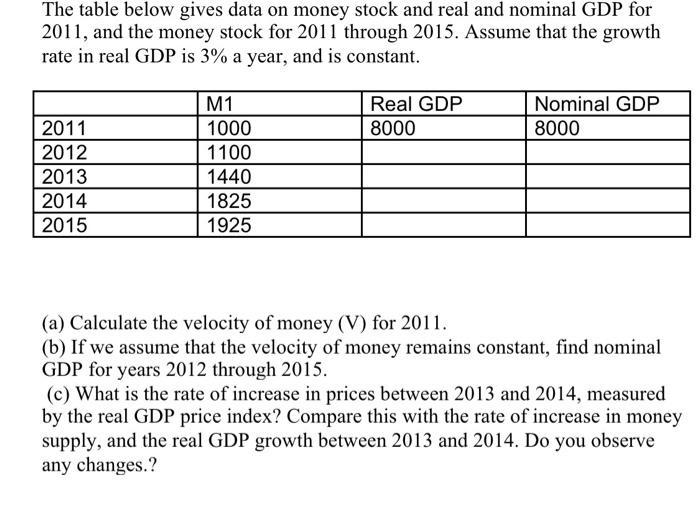
image text in transcribed
The table below gives data on money stock and real and nominal GDP for 2011, and the money stock for 2011 through 2015. Assume that the growth rate in real GDP is 3% a year, and is constant. Real GDP 8000 Nominal GDP 8000 2011 2012 2013 2014 2015 M1 1000 1100 1440 1825 1925 (a) Calculate the velocity of money (V) for 2011. (b) If we assume that the velocity of money remains constant, find nominal GDP for years 2012 through 2015. (c) What is the rate of increase in prices between 2013 and 2014, measured by the real GDP price index? Compare this with the rate of increase in money supply, and the real GDP growth between 2013 and 2014. Do you observe any changes

Step by Step Solution

There are 3 Steps involved in it

Step: 1

blur-text-image

Get Instant Access to Expert-Tailored Solutions

See step-by-step solutions with expert insights and AI powered tools for academic success

Step: 2

blur-text-image_2

Step: 3

blur-text-image_3

Ace Your Homework with AI

Get the answers you need in no time with our AI-driven, step-by-step assistance

Get Started

Recommended Textbook for

Applied Econometric Time Series

Authors: Walter Enders

4th Edition

1118808568, 9781118808566

More Books

Students also viewed these Economics questions