Answered step by step
Verified Expert Solution
Question
1 Approved Answer
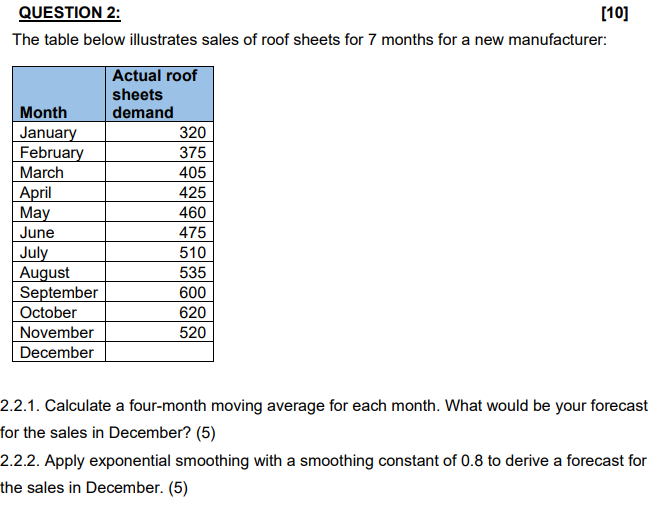
The table below illustrates sales of roof sheets for 7 months for a new manufacturer: 2.2.1. Calculate a four-month moving average for each month. What
 The table below illustrates sales of roof sheets for 7 months for a new manufacturer: 2.2.1. Calculate a four-month moving average for each month. What would be your forecast for the sales in December? (5) 2.2.2. Apply exponential smoothing with a smoothing constant of 0.8 to derive a forecast for the sales in December
 Step by Step Solution
There are 3 Steps involved in it
Step: 1

Get Instant Access to Expert-Tailored Solutions
See step-by-step solutions with expert insights and AI powered tools for academic success
Step: 2

Step: 3

Ace Your Homework with AI
Get the answers you need in no time with our AI-driven, step-by-step assistance
Get Started


