Answered step by step
Verified Expert Solution
Link Copied!

Question

1 Approved Answer

The Table below presents the information for a high growth company and the overall S&P 500 index. High-Growth Co. S&P 500 P/E ratio 18.24 14.24
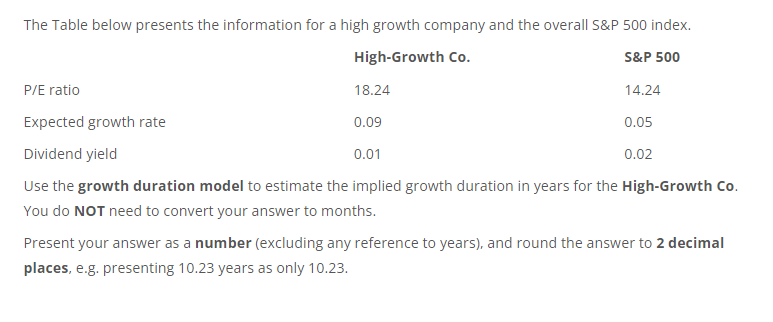
image text in transcribed

The Table below presents the information for a high growth company and the overall S&P 500 index. High-Growth Co. S&P 500 P/E ratio 18.24 14.24 Expected growth rate 0.09 0.05 Dividend yield 0.01 0.02 Use the growth duration model to estimate the implied growth duration in years for the High-Growth Co. You do NOT need to convert your answer to months. Present your answer as a number (excluding any reference to years), and round the answer to 2 decimal places, e.g. presenting 10.23 years as only 10.23. The Table below presents the information for a high growth company and the overall S&P 500 index. High-Growth Co. S&P 500 P/E ratio 18.24 14.24 Expected growth rate 0.09 0.05 Dividend yield 0.01 0.02 Use the growth duration model to estimate the implied growth duration in years for the High-Growth Co. You do NOT need to convert your answer to months. Present your answer as a number (excluding any reference to years), and round the answer to 2 decimal places, e.g. presenting 10.23 years as only 10.23

Step by Step Solution

There are 3 Steps involved in it

Step: 1

blur-text-image

Get Instant Access to Expert-Tailored Solutions

See step-by-step solutions with expert insights and AI powered tools for academic success

Step: 2

blur-text-image_step_2

Step: 3

blur-text-image_step3

Ace Your Homework with AI

Get the answers you need in no time with our AI-driven, step-by-step assistance

Get Started

Recommended Textbook for

More Books

Students also viewed these Finance questions