Answered step by step
Verified Expert Solution
Question
1 Approved Answer
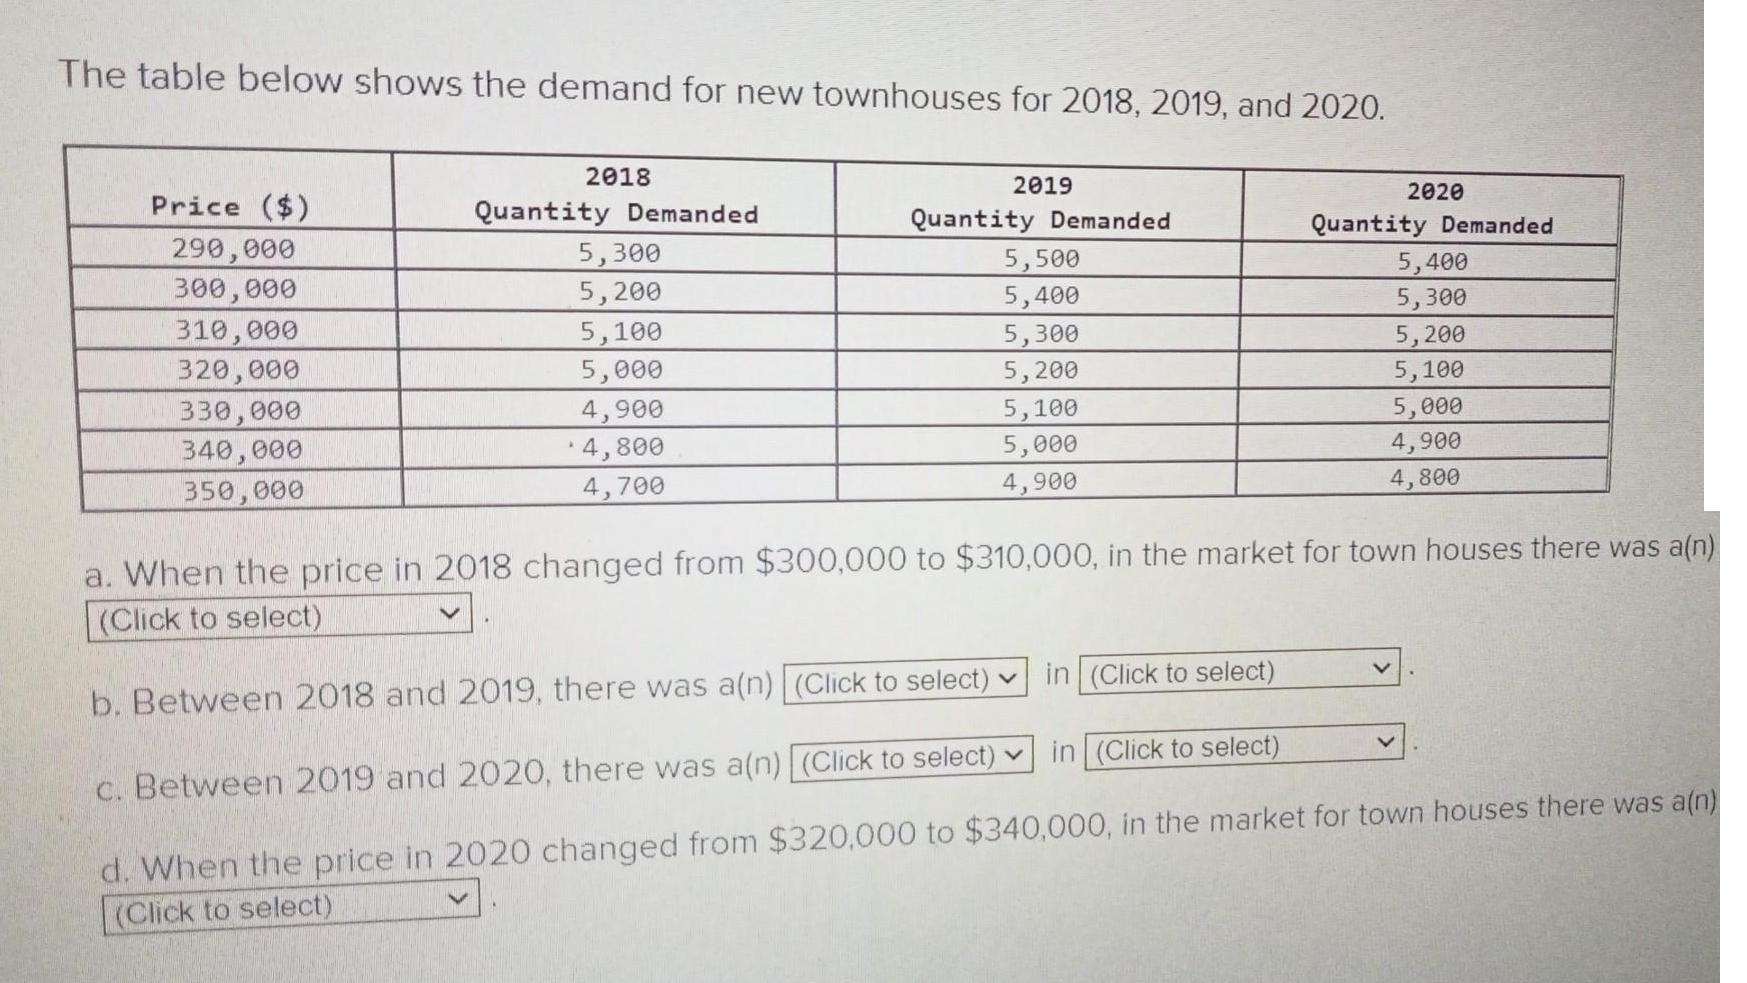
The table below shows the demand for new townhouses for 2018, 2019, and 2020. Price ($) 290,000 300,000 310,000 320,000 330,000 340,000 350,000 2018

The table below shows the demand for new townhouses for 2018, 2019, and 2020. Price ($) 290,000 300,000 310,000 320,000 330,000 340,000 350,000 2018 Quantity Demanded 5,300 5,200 5,100 5,000 4,900 4,800 4,700 2019 Quantity Demanded 5,500 5,400 5,300 5,200 5,100 5,000 4,900 2020 in (Click to select) in (Click to select) Quantity Demanded 5,400 5,300 5,200 5,100 5,000 4,900 4,800 a. When the price in 2018 changed from $300,000 to $310,000, in the market for town houses there was a(n) (Click to select) b. Between 2018 and 2019, there was a(n) (Click to select) c. Between 2019 and 2020, there was a(n) (Click to select) d. When the price in 2020 changed from $320,000 to $340,000, in the market for town houses there was a(n) (Click to select)
Step by Step Solution
★★★★★
3.42 Rating (158 Votes )
There are 3 Steps involved in it
Step: 1
a When the price in 2018 changed from 300000 to 310000 in the market for town houses there was an de...
Get Instant Access to Expert-Tailored Solutions
See step-by-step solutions with expert insights and AI powered tools for academic success
Step: 2

Step: 3

Ace Your Homework with AI
Get the answers you need in no time with our AI-driven, step-by-step assistance
Get Started


