Answered step by step
Verified Expert Solution
Question
1 Approved Answer
The table below shows the solubility of a certain organic compound in water at five different temperatures. a. Plot a graph of the solubility of
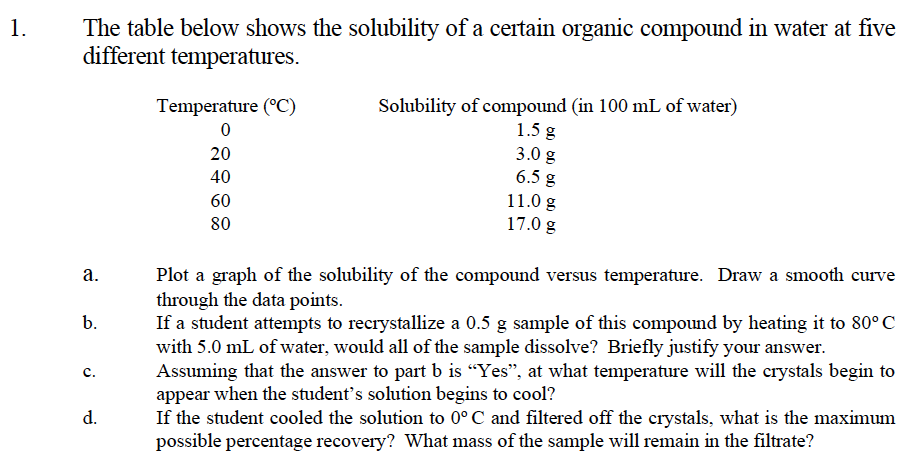
The table below shows the solubility of a certain organic compound in water at five different temperatures. a. Plot a graph of the solubility of the compound versus temperature. Draw a smooth curve through the data points. b. If a student attempts to recrystallize a 0.5g sample of this compound by heating it to 80C with 5.0mL of water, would all of the sample dissolve? Briefly justify your answer. c. Assuming that the answer to part b is "Yes", at what temperature will the crystals begin to appear when the student's solution begins to cool? d. If the student cooled the solution to 0C and filtered off the crystals, what is the maximum possible percentage recovery? What mass of the sample will remain in the filtrate
Step by Step Solution
There are 3 Steps involved in it
Step: 1
Get Instant Access to Expert-Tailored Solutions
See step-by-step solutions with expert insights and AI powered tools for academic success
Step: 2
Step: 3
Ace Your Homework with AI
Get the answers you need in no time with our AI-driven, step-by-step assistance
Get Started