

Question
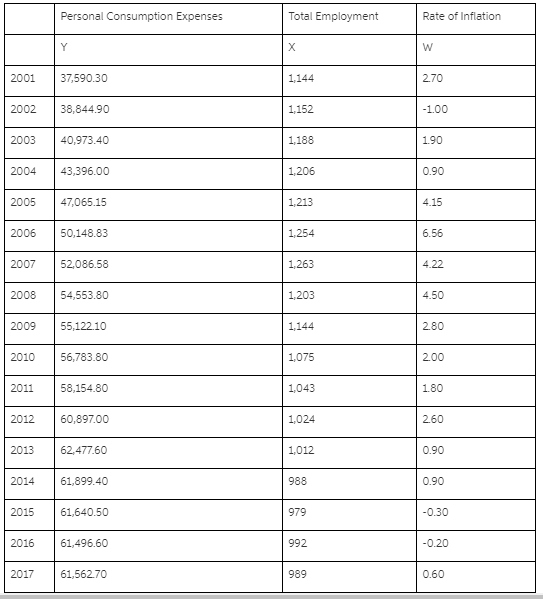
The table provided presents data related to the level of personal consumption expenses of the Puerto Rican population for the period from 2001 to 2017,
The table provided presents data related to the level of personal consumption expenses of the Puerto Rican population for the period from 2001 to 2017, real data. We are interested in identifying the best statistical relationship between the level of personal consumption expenses with the level of the inflation rate and total employment.
Step by Step Solution
There are 3 Steps involved in it
Step: 1

Get Instant Access to Expert-Tailored Solutions
See step-by-step solutions with expert insights and AI powered tools for academic success
Step: 2

Step: 3
Ace Your Homework with AI
Get the answers you need in no time with our AI-driven, step-by-step assistance
Get Started
Beginning Algebra A Text/Workbook
Authors: Charles P McKeague
2nd Edition
1483271242, 9781483271248