Answered step by step
Verified Expert Solution
Question
1 Approved Answer
The table represents an income-expenditure table. Fill in the missing numbers and then identify the equilibrium levels of GDP and planned aggregate spending. Real
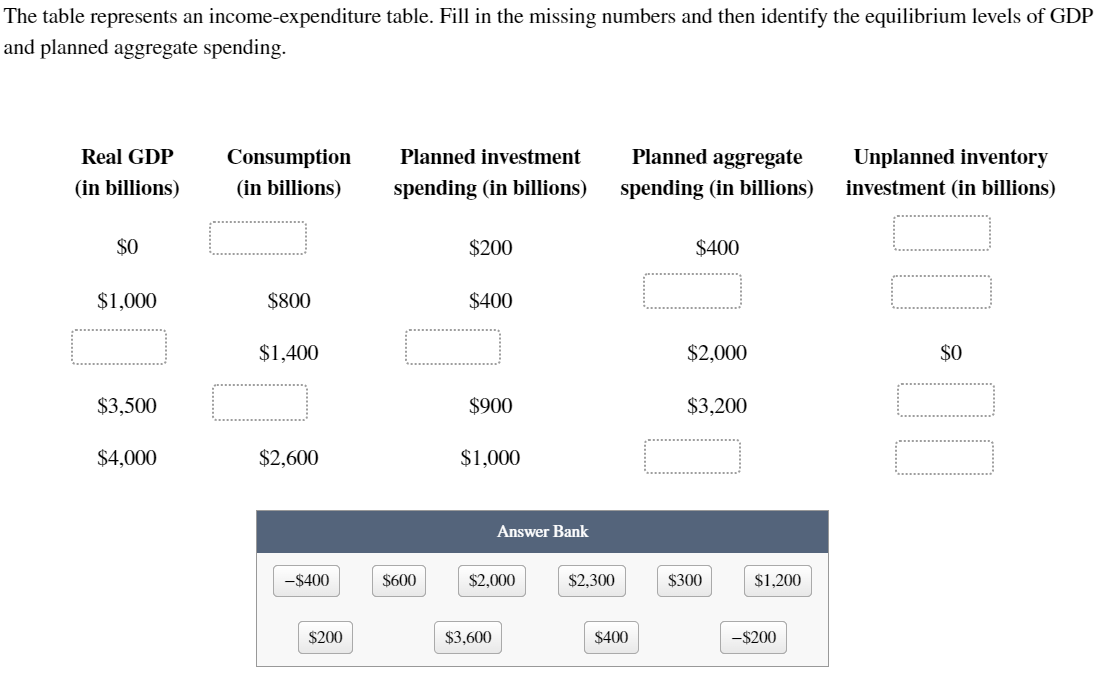
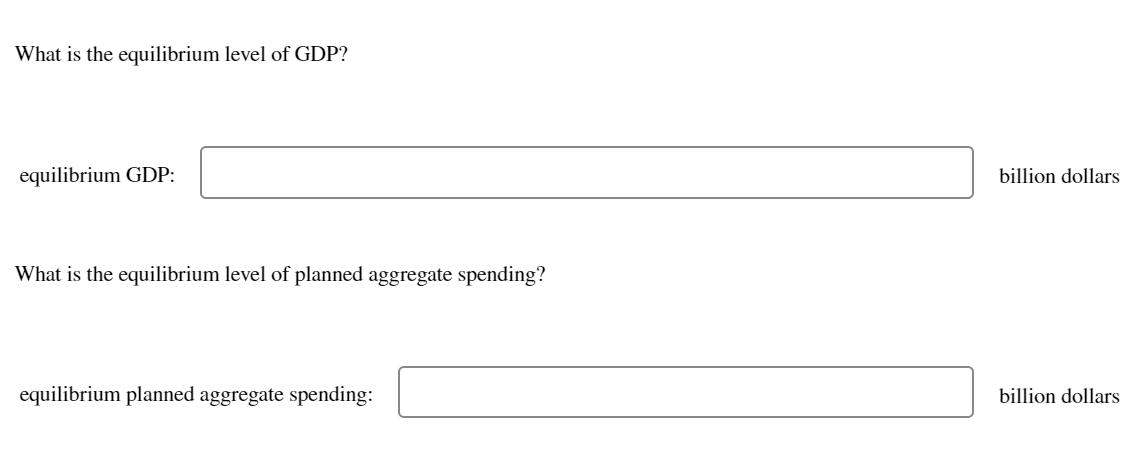
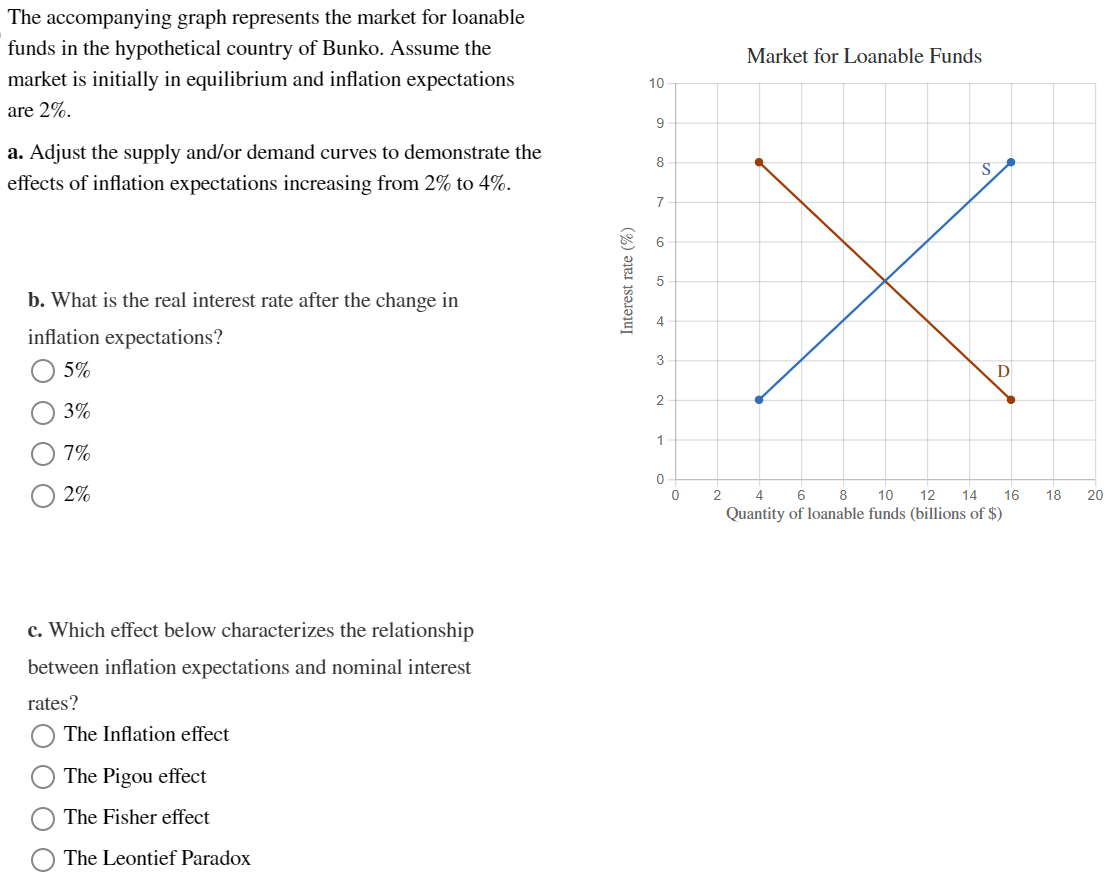
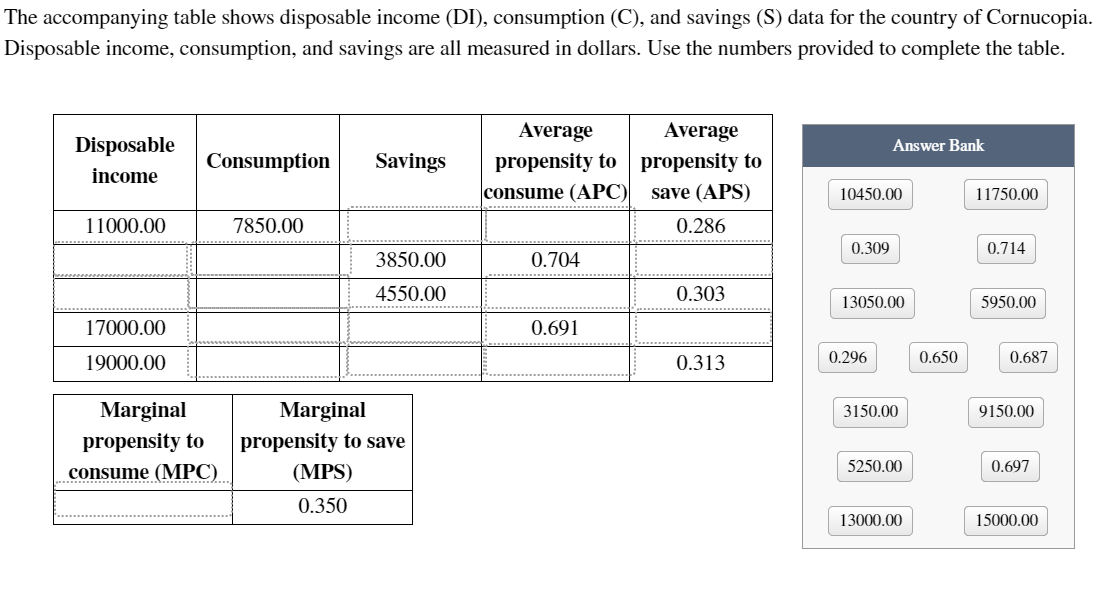
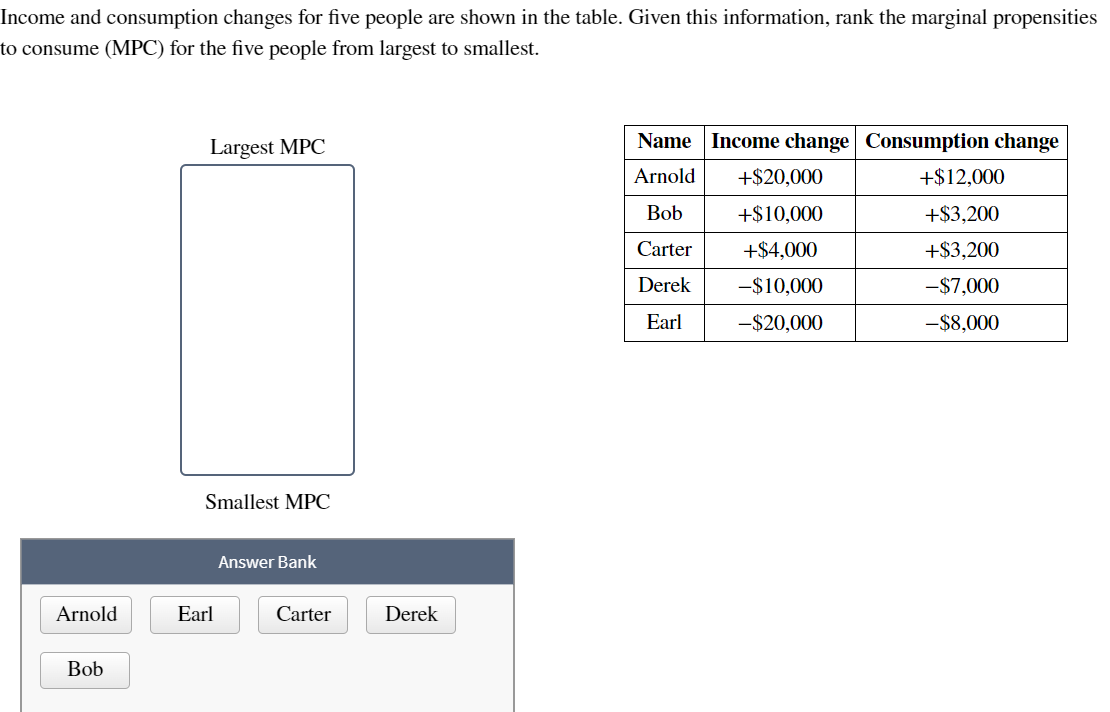
The table represents an income-expenditure table. Fill in the missing numbers and then identify the equilibrium levels of GDP and planned aggregate spending. Real GDP (in billions) $0 $1,000 $3,500 $4,000 Consumption (in billions) $800 $1,400 $2,600 -$400 $200 Planned investment spending (in billions) $600 $200 $400 $900 $1,000 Answer Bank $2,000 $3,600 $2,300 Planned aggregate spending (in billions) $400 $400 $2,000 $3,200 $300 $1,200 -$200 Unplanned inventory investment (in billions) $0 00 What is the equilibrium level of GDP? equilibrium GDP: What is the equilibrium level of planned aggregate spending? equilibrium planned aggregate spending: billion dollars billion dollars The accompanying graph represents the market for loanable funds in the hypothetical country of Bunko. Assume the market is initially in equilibrium and inflation expectations are 2%. a. Adjust the supply and/or demand curves to demonstrate the effects of inflation expectations increasing from 2% to 4%. b. What is the real interest rate after the change in inflation expectations? 5% 3% 7% 2% c. Which effect below characterizes the relationship between inflation expectations and nominal interest rates? The Inflation effect The Pigou effect The Fisher effect The Leontief Paradox Interest rate (%) 10 9 8 7 3 2 1 0 0 2 Market for Loanable Funds S D 4 6 8 10 12 14 16 Quantity of loanable funds (billions of $) 18 20 The accompanying table shows disposable income (DI), consumption (C), and savings (S) data for the country of Cornucopia. Disposable income, consumption, and savings are all measured in dollars. Use the numbers provided to complete the table. Disposable income 11000.00 17000.00 19000.00 Consumption Marginal propensity to consume (MPC) 7850.00 Savings 3850.00 4550.00 Marginal propensity to save (MPS) 0.350 Average propensity to consume (APC) 0.704 0.691 Average propensity to save (APS) 0.286 0.303 0.313 10450.00 0.309 Answer Bank 13050.00 0.296 3150.00 5250.00 13000.00 0.650 11750.00 0.714 5950.00 0.687 9150.00 0.697 15000.00 Income and consumption changes for five people are shown in the table. Given this information, rank the marginal propensities to consume (MPC) for the five people from largest to smallest. Arnold Bob Largest MPC Smallest MPC Earl Answer Bank Carter Derek Name Income change Consumption change Arnold +$20,000 Bob +$10,000 Carter +$4,000 Derek -$10,000 Earl -$20,000 +$12,000 +$3,200 +$3,200 -$7,000 -$8,000
Step by Step Solution
★★★★★
3.37 Rating (147 Votes )
There are 3 Steps involved in it
Step: 1

Get Instant Access to Expert-Tailored Solutions
See step-by-step solutions with expert insights and AI powered tools for academic success
Step: 2

Step: 3

Ace Your Homework with AI
Get the answers you need in no time with our AI-driven, step-by-step assistance
Get Started


