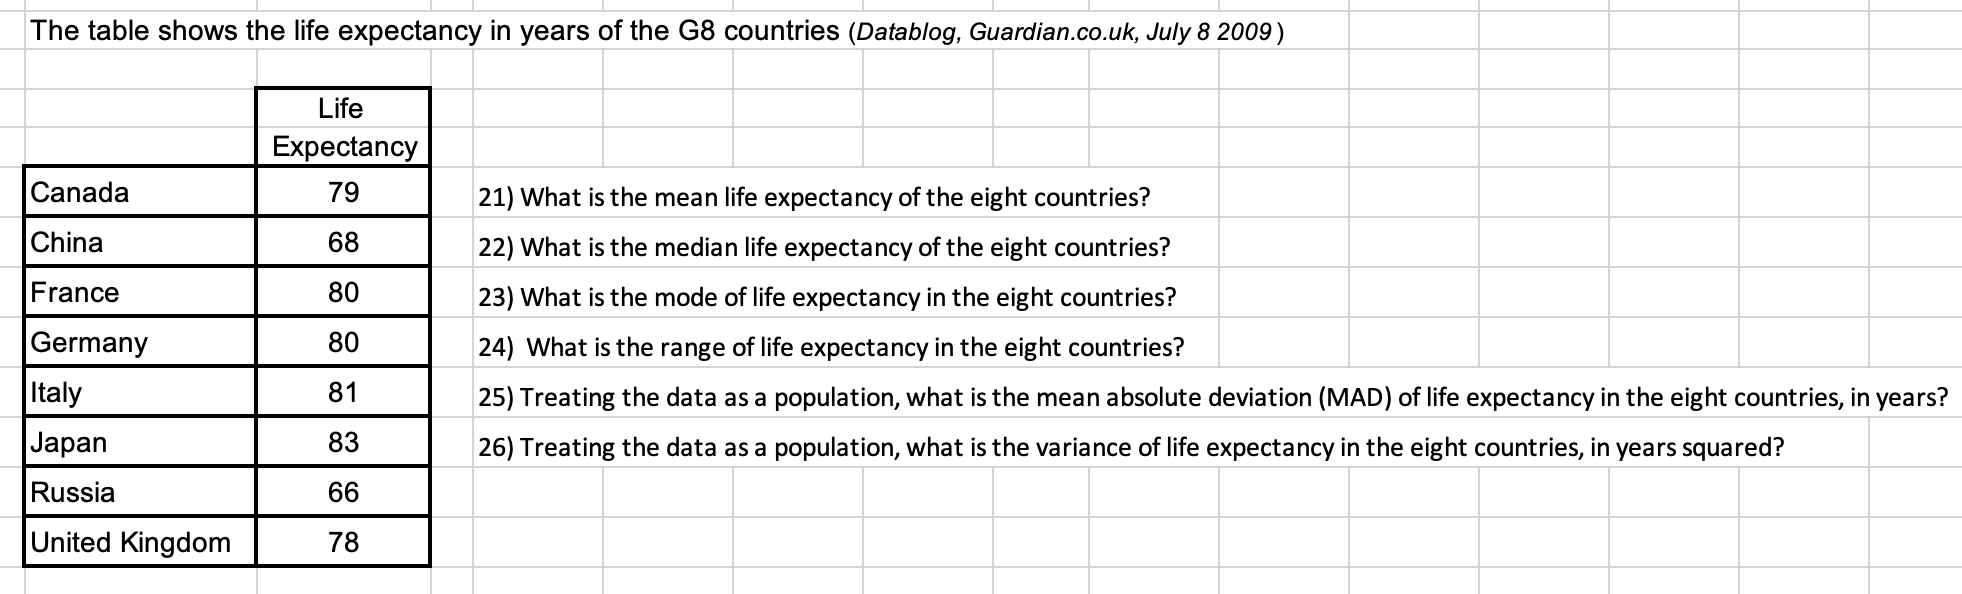
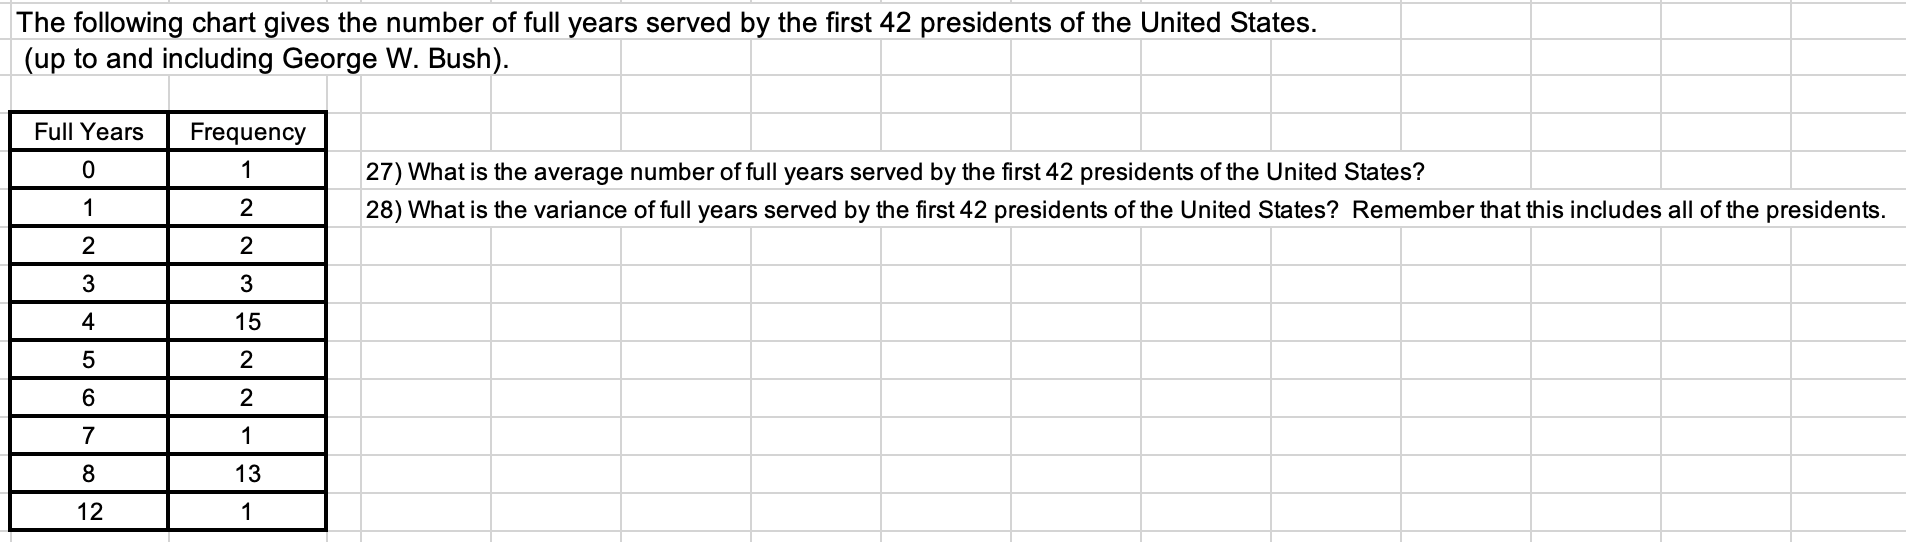
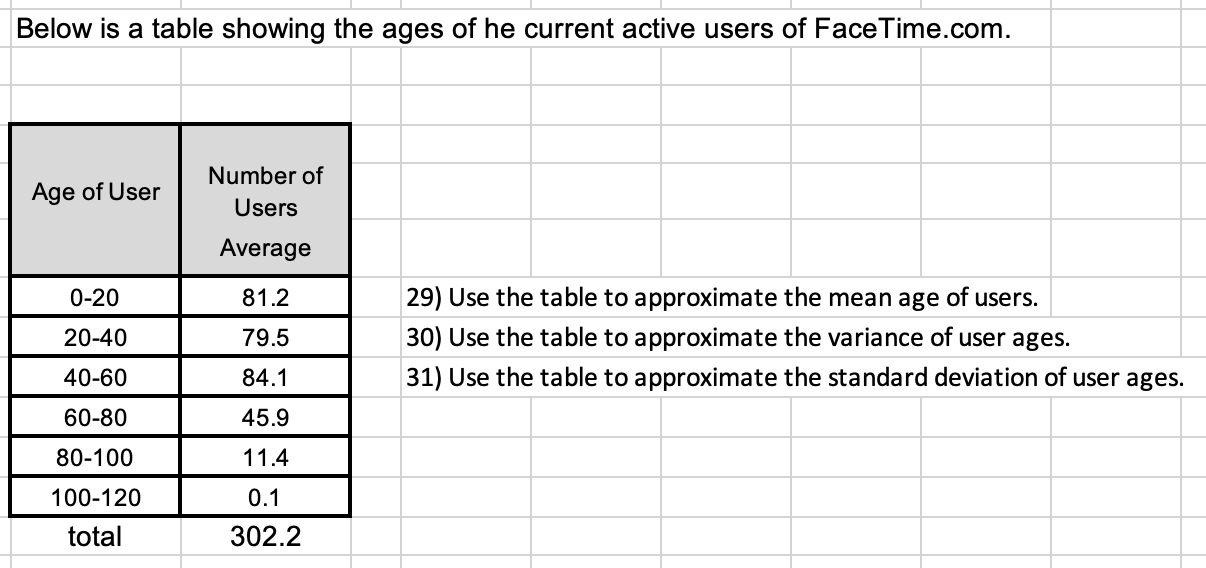
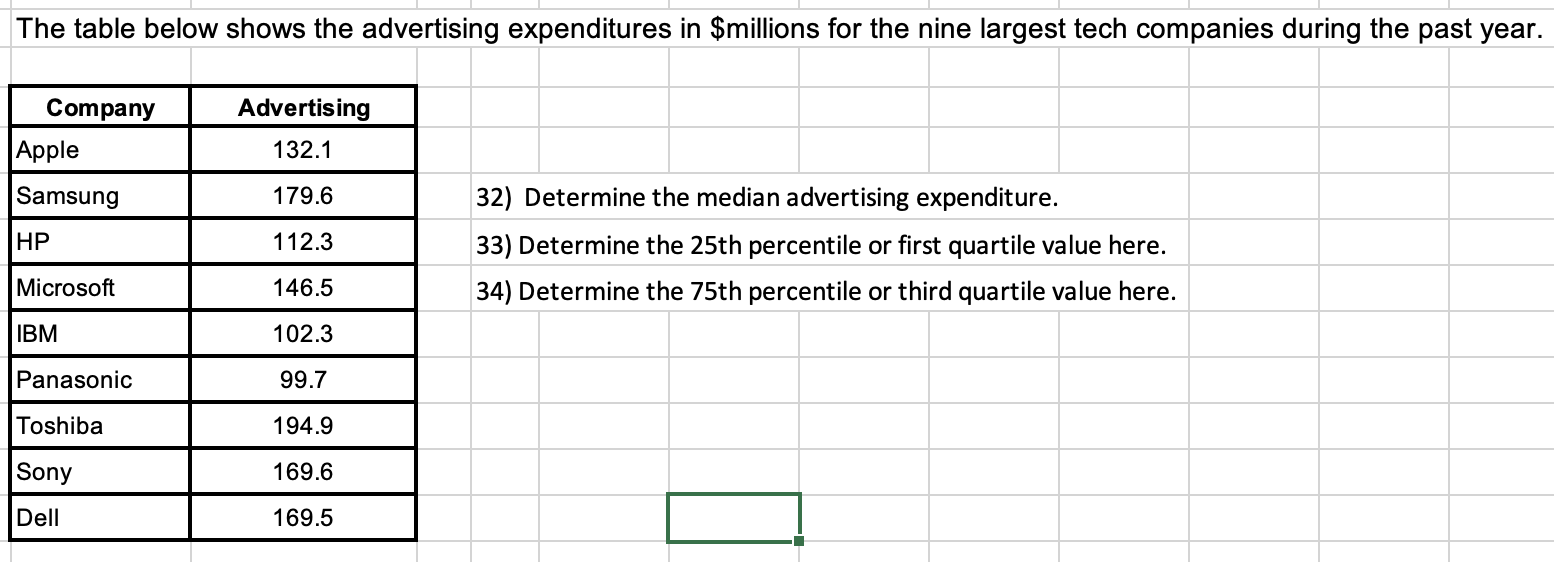
The table shows the life expectancy in years of the GB countries (Datablog, Guardian.co.uk, July8 2009) Life Expectancy 7 9 81 83 w United Kingdom 21) What is the mean life expectancy of the eight countries? 22) What is the median life expectancy of the eight countries? 23) What is the mode of life expectancy in the eight countries? 24) What is the range of life expectancy in the eight countries? 25) Treating the data as a population, what is the mean absolute deviation (MAD) of life expectancy in the eight countries, in yea rs? 26) Treating the data as a population, what is the variance of life expectancy in the eight countries, in yea rs squared? 78 The following chart gives the number of full years served by the first 42 presidents of the United States. (up to and including George W. Bush). Full Years Frequency 0 27) What is the average number of full years served by the first 42 presidents of the United States? N - INN 28) What is the variance of full years served by the first 42 presidents of the United States? Remember that this includes all of the presidents. 3 A 15 IN 8 13 12 1Below is a table showing the ages of he current active users of FaceTime.com. Number of Users Age of User Average m_ 29) Use the table to approximate the mean age of users. 30) Use the table to approximate the variance of user ages. 31) Use the table to approximate the standard deviation of user ages. m total 302.2 The table below shows the advertising expenditures in $millions for the nine largest tech companies during the past year. m 32) Determine the median advertising expenditure. _ 33) Determine the 25th percentile or rst quartile value here. _\" 34) Determine the 75th percentile or third quartile value here. um I :1 Profits (in $millions) for Caldwell-Hewitt's US Division and European Division over the past four years are shown below Year US Europe 1 6.9 15.4 35) Calculate the correlation coefficient, based on this coefficient you can assert that: 2 6.3 15 3 7.1 13 4 7.4 16.2We are betting in a 4-horse race, we know the odds and have translated the odds to the mean of their winning chance, we also know the standard deviation of their last 10 races winning 36 How would a rational bettor place hislhers win, place, show (1st, 2nd, 3rd) bet? odds chance Std. Dev Andrew Costanzo has a stock portfolio that contains 24 shares of stock A and six shares of stock B. Over the past year, the value of a share of stock A went up to $4.00 and the value of a share of stock B fell to $59. 37) Apply a weighted average approach to produce the current average value per share in Andrew's portfolio. No. of Shares Price $ Stock A 24 4 Stock B 6 59The table below shows the grades for three students, the credits of the classes and the grading scale Grading Scale ymym A- A B B B 38) using the credits as the weights and the grading scale. Rank the students, by their weighted average grade point, highest to lowest