Answered step by step
Verified Expert Solution
Question
1 Approved Answer
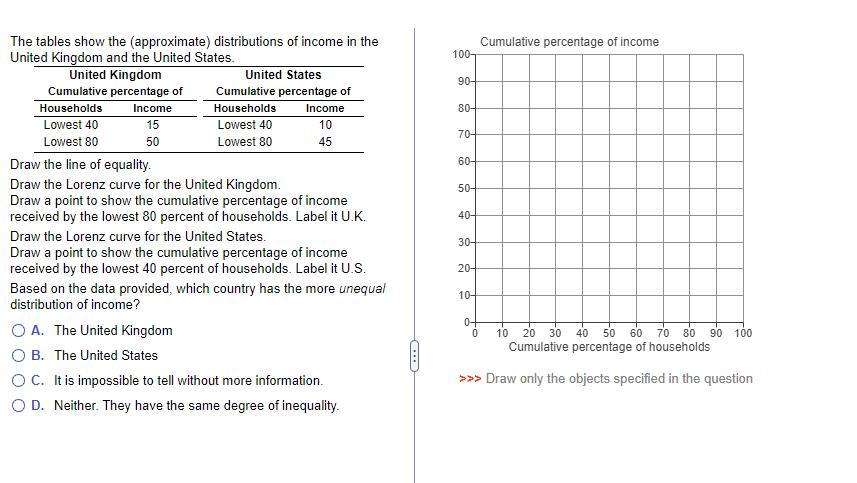
The tables show the (approximate) distributions of income in the United Kingdom and the United States. United Kingdom Cumulative percentage of Households Lowest 40

The tables show the (approximate) distributions of income in the United Kingdom and the United States. United Kingdom Cumulative percentage of Households Lowest 40 Lowest 80 Income 15 50 United States Cumulative percentage of Households O A. The United Kingdom O B. The United States Lowest 40 Lowest 80 Income 10 45 Draw the line of equality. Draw the Lorenz curve for the United Kingdom. Draw a point to show the cumulative percentage of income received by the lowest 80 percent of households. Label it U.K. Draw the Lorenz curve for the United States. Draw a point to show the cumulative percentage of income received by the lowest 40 percent of households. Label it U.S. Based on the data provided, which country has the more unequal distribution of income? OC. It is impossible to tell without more information. O D. Neither. They have the same degree of inequality. C... 100- 90- 80- 70- 60- 50- 40- 30- 20- 10- Cumulative percentage of income 0 10 20 30 40 50 60 70 80 90 100 Cumulative percentage of households >>> Draw only the objects specified in the question
Step by Step Solution
★★★★★
3.30 Rating (144 Votes )
There are 3 Steps involved in it
Step: 1
OR Note The Lorenz Curve never lies above th...
Get Instant Access to Expert-Tailored Solutions
See step-by-step solutions with expert insights and AI powered tools for academic success
Step: 2

Step: 3

Ace Your Homework with AI
Get the answers you need in no time with our AI-driven, step-by-step assistance
Get Started


