The terms of the AOL-Time Warner merger represent a significant premium to Time Warner shareholders. Quantify this premium. (Note: use the number of shares on pages 13 and 16 of the proxy statement 2,255 for AOL and 1,301.5 for TW). Page 13 is the First Graphic Here and Page 16 is the Last Graphic here.
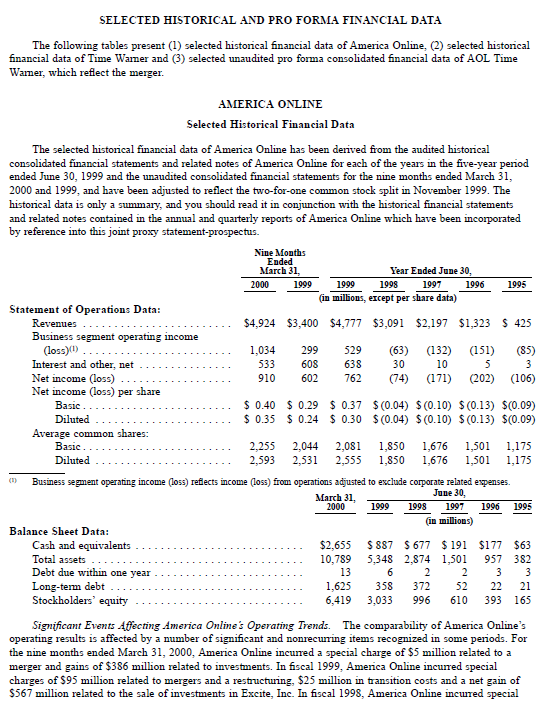
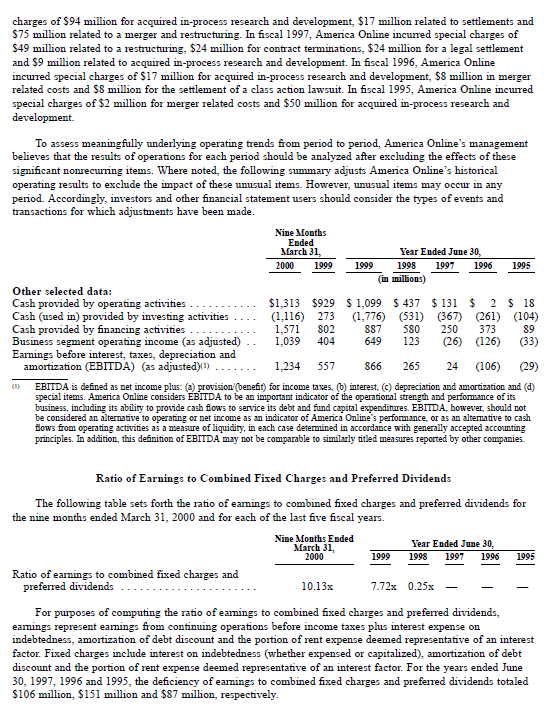
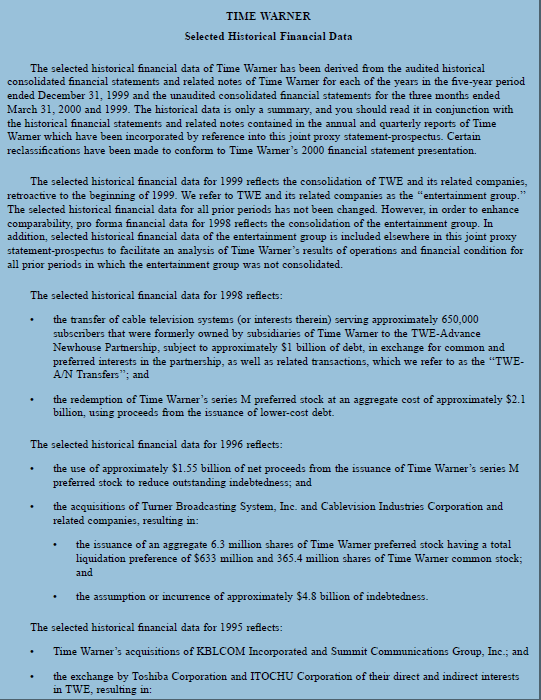
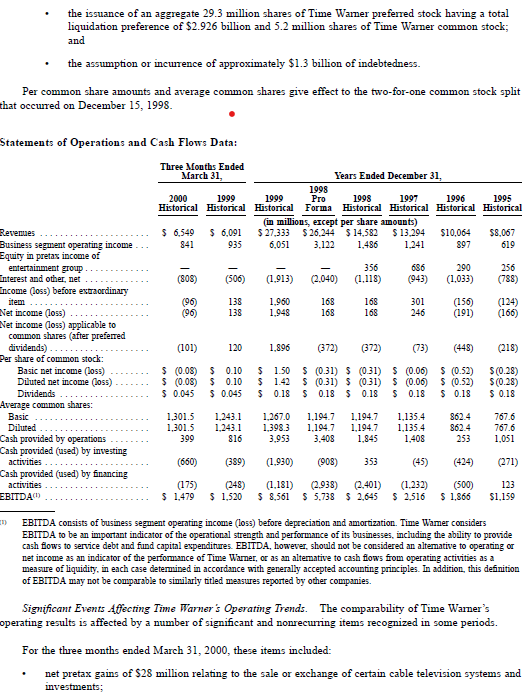
1995 SELECTED HISTORICAL AND PRO FORMA FINANCIAL DATA The following tables present (1) selected historical financial data of America Online, (2) selected historical financial data of Time Wamer and (3) selected unaudited pro forma consolidated financial data of AOL Time Wamer, which reflect the merger. AMERICA ONLINE Selected Historical Financial Data The selected historical financial data of America Online has been derived from the audited historical consolidated financial statements and related notes of America Online for each of the years in the five-year period ended June 30, 1999 and the unaudited consolidated financial statements for the nine months ended March 31, 2000 and 1999, and have been adjusted to reflect the two-for-one common stock split in November 1999. The historical data is only a summary, and you should read it in conjunction with the historical financial statements and related notes contained in the annual and quarterly reports of America Online which have been incorporated by reference into this joint proxy statement-prospectus. Nine Months Ended March 31, Year Ended June 30, 2000 1999 1999 1998 1997 1996 (in millions, except per share data) Statement of Operations Data: Revenues $4,924 $3,400 $4,777 $3,091 $2,197 $1,323 $ 425 Business segment operating income (Loss)) 1,034 299 529 (63) (132) (151) (85) Interest and other, net 533 608 638 30 10 5 3 Net income (loss) 910 602 762 (74) (171) (202) (106) Net income (loss) per share Basic $ 0.40 $ 0.29 $ 0.37 $(0.04) $(0.10) $(0.13) $(0.09) Diluted $ 0.35 $ 0.24 $0.30 $(0.04) $ (0.10) $ (0.13) $(0.09) Average common shares: Basic 2.255 2,044 2,081 1,850 1,676 1,501 1,175 Diluted 2,593 2,531 2,555 1,850 1,676 1,501 1,175 Business segment operating income (Loss) reflects income (Loss) from operations adjusted to exclude corporate related expenses. March 31, June 30, 2000 1999 1998 1997 1996 1995 (in millions) Balance Sheet Data: Cash and equivalents $2,655 S887 $ 677 $ 191 $177 $63 Total assets 10,789 5,348 2.874 1,501 957 382 Debt due within one year 13 6 2 2 3 3 Long-term debt 1,625 358 372 52 22 21 Stockholders' equity 6,419 3,033 996 610 393 165 Significant Events Affecting America Online's Operating Trends. The comparability of America Online's operating results is affected by a number of significant and nonrecurring items recognized in some periods. For the nine months ended March 31, 2000, America Online incurred a special charge of $5 million related to a merger and gains of $386 million related to investments. In fiscal 1999, America Online incurred special charges of $95 million related to mergers and a restructwing, $25 million in transition costs and a net gain of $567 million related to the sale of investments in Excite, Inc. In fiscal 1998, America Online incured special charges of $94 million for acquired in-process research and development, $17 million related to settlements and $75 million related to a merger and restructuring. In fiscal 1997, America Online incurred special charges of $49 million related to a restructuring, $24 million for contract terminations, $24 million for a legal settlement and $9 million related to acquired in-process research and development. In fiscal 1996, America Online incwred special charges of $17 million for acquired in-process research and development, $8 million in merger related costs and $8 million for the settlement of a class action lawsuit. In fiscal 1995, America Online incurred special charges of $2 million for merger related costs and $50 million for acquired in-process research and development. To assess meaningfully underlying operating trends from period to period, America Online's management believes that the results of operations for each period should be analyzed after excluding the effects of these significant nonrecurring items. Where noted, the following summary adjusts America Online's historical operating results to exclude the impact of these unusual items. However, unusual items may occur in any period. Accordingly, investors and other financial statement users should consider the types of events and transactions for which adjustments have been made. Nine Months Ended March 31, Year Ended June 30, 2000 1999 1999 1998 1996 (in millions) Other selected data: Cash provided by operating activities $1,313 $929 $ 1,099 $ 437 $ 131 $ 2 $ 18 Cash (used in) provided by investing activities (1,116) 273 (1,776) (531) (367) (261) (104) Cash provided by financing activities 1.571 802 887 580 250 373 89 Business segment operating income (as adjusted) 1,039 404 649 123 (26) (126) (33) Earnings before interest, taxes, depreciation and amortization (EBITDA) (as adjusted)(1) 1,234 557 866 265 24 (106) (29) EBITDA is defined as net income plus: (a) provision (benefit) for income taxes. (b) interest. (c) depreciation and amortization and (d) special items. America Online considers EBITDA to be an important indicator of the operational strength and performance of its business, including its ability to provide cash flows to service its debt and fund capital expenditures. EBITDA, however, should not be considered an alternative to operating or net income as an indicator of America Online's performance, or as an alterative to cash flows from operating activities as a measure of liquidity, in each case determined in accordance with generally accepted accounting principles. In addition, this definition of EBITDA may not be comparable to similarly titled measures reported by other companies. 1997 1995 Ratio of Earnings to Combined Fixed Charges and Preferred Dividends The following table sets forth the ratio of eamings to combined fixed charges and preferred dividends for the nine months ended March 31, 2000 and for each of the last five fiscal years. Nine Months Ended March 31, Year Ended June 30, 2000 1999 1998 1997 1996 1995 Ratio of earnings to combined fixed charges and preferred dividends 10.13x 7.72x 0.25% For purposes of computing the ratio of eamings to combined fixed charges and preferred dividends, eamings represent earings from continuing operations before income taxes plus interest expense on indebtedness, amortization of debt discount and the portion of rent expense deemed representative of an interest factor. Fixed charges include interest on indebtedness (whether expensed or capitalized), amortization of debt discount and the portion of rent expense deemed representative of an interest factor. For the years ended June 30, 1997, 1996 and 1995, the deficiency of eamings to combined fixed charges and preferred dividends totaled $106 million, $151 million and $87 million, respectively. TIME WARNER Selected Historical Financial Data The selected historical financial data of Time Wamer has been derived from the audited historical consolidated financial statements and related notes of Time Wamer for each of the years in the five-year period ended December 31, 1999 and the unaudited consolidated financial statements for the three months ended March 31, 2000 and 1999. The historical data is only a summary, and you should read it in conjunction with the historical financial statements and related notes contained in the annual and quarterly reports of Time Wamer which have been incorporated by reference into this joint proxy statement-prospectus. Certain reclassifications have been made to conform to Time Wamer's 2000 financial statement presentation. The selected historical financial data for 1999 reflects the consolidation of TWE and its related companies, retroactive to the beginning of 1999. We refer to TWE and its related companies as the "entertainment group. The selected historical financial data for all prior periods has not been changed. However, in order to enhance comparability, pro forma financial data for 1998 reflects the consolidation of the entertainment group. In addition, selected historical financial data of the entertainment group is included elsewhere in this joint proxy statement-prospectus to facilitate an analysis of Time Warmer's results of operations and financial condition for all prior periods in which the entertainment group was not consolidated. The selected historical financial data for 1998 reflects: the transfer of cable television systems (or interests therein) serving approximately 650,000 subscribers that were formerly owned by subsidiaries of Time Warner to the TWE-Advance Newhouse Partnership, subject to approximately $1 billion of debt, in exchange for common and preferred interests in the partnership, as well as related transactions, which we refer to as the "TWE- AN Transfers"; and the redemption of Time Warner's series M preferred stock at an aggregate cost of approximately $2.1 billion, using proceeds from the issuance of lower-cost debt. . The selected historical financial data for 1996 reflects: the use of approximately $1.55 billion of net proceeds from the issuance of Time Warner's series M preferred stock to reduce outstanding indebtedness; and the acquisitions of Tuner Broadcasting System, Inc. and Cablevision Industries Corporation and related companies, resulting in: the issuance of an aggregate 6.3 million shares of Time Wamer preferred stock having a total liquidation preference of $633 million and 365.4 million shares of Time Wamer common stock; and the assumption or incwrence of approximately $4.8 billion of indebtedness. The selected historical financial data for 1995 reflects: Time Warner's acquisitions of KBLCOM Incorporated and Summit Communications Group, Inc.; and the exchange by Toshiba Corporation and ITOCHU Corporation of their direct and indirect interests in TWE, resulting in: . the issuance of an aggregate 29.3 million shares of Time Wamer preferred stock having a total liquidation preference of $2.926 billion and 5.2 million shares of Time Warner common stock; and the assumption or incurrence of approximately $1.3 billion of indebtedness. Per common share amounts and average common shares give effect to the two-for-one common stock split that occured on December 15, 1998. Statements of Operations and Cash Flows Data: Three Months Ended March 31, Years Ended December 31, 1998 2000 1999 1999 Pro 1998 1997 1996 1995 Historical Historical Historical Forma Historical Historical Historical Historical (in millions, except per share amounts) $ 6,549 $ 6,091 $ 27,333 $ 26,244 $ 14,582 $ 13.294 $10,064 $8,067 841 935 6,051 3.122 1.486 1.241 897 619 Revenues Business segment operating income Equity in pretax income of entertainment group Interest and other net Encome (Loss) before extraordinary (808) (506) (1,913) (2.040) 356 (1.118) 686 (943) 290 (1,033) 256 (788) (96) (96) 138 138 1,960 1.948 168 168 168 168 301 246 (156) (191) (124) (166) (101) 120 1.896 (372) (372) (73) (448) (218) $ (0.08) $ 0.10 $ (0.08) $ 0.10 $ 0.045 $ 0.045 $ 1.50 $ (0.31) $ (0.31) $ (0.06) $ (0.52) $ 1.42 S (0.31) $ (0.31) $ (0.06) S (0.52) $ 0.18 $ 0.18 $ 0.18 $ 0.18 $ 0.18 S (0.28) $(0.28) $ 0.18 Net income (loss) Net income (loss) applicable to common shares (after preferred dividends) Per share of common stock: Basic net income (loss) Diluted net income (loss) Dividends Average common shares: Basic Diluted Cash provided by operations Cash provided (used) by investing activities Cash provided (used) by financing activities EBITDA 1.301.5 1,301.5 399 1.243.1 1,243.1 816 1,267.0 1,398.3 3.953 1.194.7 1.194.7 3,408 1,194.7 1,194.7 1,845 1.135.4 1.135.4 1.408 862.4 862.4 253 767.6 767.6 1,051 (660) (389) (1.930) (908) 353 (45) (424) (271) (175) (248) $ 1.520 (1.181) (2.938) (2.401) $ 8,561 $ 5.738 $ 2,645 (1.232) $ 2,516 (500) $ 1.866 123 $1.159 $ 1.479 EBITDA consists of business segment operating income (Loss) before depreciation and amortization. Time Wamer considers EBITDA to be an important indicator of the operational strength and performance of its businesses, including the ability to provide cash flows to service debt and fund capital expenditures EBITDA, however, should not be considered an alternative to operating or net income as an indicator of the performance of Time Warner, or as an alternative to cash flows from operating activities as a measure of liquidity, in each case determined in accordance with generally accepted accounting principles. In addition, this definition of EBITDA may not be comparable to similarly titled measures reported by other companies. Significant Events Affecting Time Warner's Operating Trends. The comparability of Time Warner's operating results is affected by a number of significant and nonrecurring items recognized in some periods. For the three months ended March 31, 2000, these items included: net pretax gains of $28 million relating to the sale or exchange of certain cable television systems and investments; 1995 SELECTED HISTORICAL AND PRO FORMA FINANCIAL DATA The following tables present (1) selected historical financial data of America Online, (2) selected historical financial data of Time Wamer and (3) selected unaudited pro forma consolidated financial data of AOL Time Wamer, which reflect the merger. AMERICA ONLINE Selected Historical Financial Data The selected historical financial data of America Online has been derived from the audited historical consolidated financial statements and related notes of America Online for each of the years in the five-year period ended June 30, 1999 and the unaudited consolidated financial statements for the nine months ended March 31, 2000 and 1999, and have been adjusted to reflect the two-for-one common stock split in November 1999. The historical data is only a summary, and you should read it in conjunction with the historical financial statements and related notes contained in the annual and quarterly reports of America Online which have been incorporated by reference into this joint proxy statement-prospectus. Nine Months Ended March 31, Year Ended June 30, 2000 1999 1999 1998 1997 1996 (in millions, except per share data) Statement of Operations Data: Revenues $4,924 $3,400 $4,777 $3,091 $2,197 $1,323 $ 425 Business segment operating income (Loss)) 1,034 299 529 (63) (132) (151) (85) Interest and other, net 533 608 638 30 10 5 3 Net income (loss) 910 602 762 (74) (171) (202) (106) Net income (loss) per share Basic $ 0.40 $ 0.29 $ 0.37 $(0.04) $(0.10) $(0.13) $(0.09) Diluted $ 0.35 $ 0.24 $0.30 $(0.04) $ (0.10) $ (0.13) $(0.09) Average common shares: Basic 2.255 2,044 2,081 1,850 1,676 1,501 1,175 Diluted 2,593 2,531 2,555 1,850 1,676 1,501 1,175 Business segment operating income (Loss) reflects income (Loss) from operations adjusted to exclude corporate related expenses. March 31, June 30, 2000 1999 1998 1997 1996 1995 (in millions) Balance Sheet Data: Cash and equivalents $2,655 S887 $ 677 $ 191 $177 $63 Total assets 10,789 5,348 2.874 1,501 957 382 Debt due within one year 13 6 2 2 3 3 Long-term debt 1,625 358 372 52 22 21 Stockholders' equity 6,419 3,033 996 610 393 165 Significant Events Affecting America Online's Operating Trends. The comparability of America Online's operating results is affected by a number of significant and nonrecurring items recognized in some periods. For the nine months ended March 31, 2000, America Online incurred a special charge of $5 million related to a merger and gains of $386 million related to investments. In fiscal 1999, America Online incurred special charges of $95 million related to mergers and a restructwing, $25 million in transition costs and a net gain of $567 million related to the sale of investments in Excite, Inc. In fiscal 1998, America Online incured special charges of $94 million for acquired in-process research and development, $17 million related to settlements and $75 million related to a merger and restructuring. In fiscal 1997, America Online incurred special charges of $49 million related to a restructuring, $24 million for contract terminations, $24 million for a legal settlement and $9 million related to acquired in-process research and development. In fiscal 1996, America Online incwred special charges of $17 million for acquired in-process research and development, $8 million in merger related costs and $8 million for the settlement of a class action lawsuit. In fiscal 1995, America Online incurred special charges of $2 million for merger related costs and $50 million for acquired in-process research and development. To assess meaningfully underlying operating trends from period to period, America Online's management believes that the results of operations for each period should be analyzed after excluding the effects of these significant nonrecurring items. Where noted, the following summary adjusts America Online's historical operating results to exclude the impact of these unusual items. However, unusual items may occur in any period. Accordingly, investors and other financial statement users should consider the types of events and transactions for which adjustments have been made. Nine Months Ended March 31, Year Ended June 30, 2000 1999 1999 1998 1996 (in millions) Other selected data: Cash provided by operating activities $1,313 $929 $ 1,099 $ 437 $ 131 $ 2 $ 18 Cash (used in) provided by investing activities (1,116) 273 (1,776) (531) (367) (261) (104) Cash provided by financing activities 1.571 802 887 580 250 373 89 Business segment operating income (as adjusted) 1,039 404 649 123 (26) (126) (33) Earnings before interest, taxes, depreciation and amortization (EBITDA) (as adjusted)(1) 1,234 557 866 265 24 (106) (29) EBITDA is defined as net income plus: (a) provision (benefit) for income taxes. (b) interest. (c) depreciation and amortization and (d) special items. America Online considers EBITDA to be an important indicator of the operational strength and performance of its business, including its ability to provide cash flows to service its debt and fund capital expenditures. EBITDA, however, should not be considered an alternative to operating or net income as an indicator of America Online's performance, or as an alterative to cash flows from operating activities as a measure of liquidity, in each case determined in accordance with generally accepted accounting principles. In addition, this definition of EBITDA may not be comparable to similarly titled measures reported by other companies. 1997 1995 Ratio of Earnings to Combined Fixed Charges and Preferred Dividends The following table sets forth the ratio of eamings to combined fixed charges and preferred dividends for the nine months ended March 31, 2000 and for each of the last five fiscal years. Nine Months Ended March 31, Year Ended June 30, 2000 1999 1998 1997 1996 1995 Ratio of earnings to combined fixed charges and preferred dividends 10.13x 7.72x 0.25% For purposes of computing the ratio of eamings to combined fixed charges and preferred dividends, eamings represent earings from continuing operations before income taxes plus interest expense on indebtedness, amortization of debt discount and the portion of rent expense deemed representative of an interest factor. Fixed charges include interest on indebtedness (whether expensed or capitalized), amortization of debt discount and the portion of rent expense deemed representative of an interest factor. For the years ended June 30, 1997, 1996 and 1995, the deficiency of eamings to combined fixed charges and preferred dividends totaled $106 million, $151 million and $87 million, respectively. TIME WARNER Selected Historical Financial Data The selected historical financial data of Time Wamer has been derived from the audited historical consolidated financial statements and related notes of Time Wamer for each of the years in the five-year period ended December 31, 1999 and the unaudited consolidated financial statements for the three months ended March 31, 2000 and 1999. The historical data is only a summary, and you should read it in conjunction with the historical financial statements and related notes contained in the annual and quarterly reports of Time Wamer which have been incorporated by reference into this joint proxy statement-prospectus. Certain reclassifications have been made to conform to Time Wamer's 2000 financial statement presentation. The selected historical financial data for 1999 reflects the consolidation of TWE and its related companies, retroactive to the beginning of 1999. We refer to TWE and its related companies as the "entertainment group. The selected historical financial data for all prior periods has not been changed. However, in order to enhance comparability, pro forma financial data for 1998 reflects the consolidation of the entertainment group. In addition, selected historical financial data of the entertainment group is included elsewhere in this joint proxy statement-prospectus to facilitate an analysis of Time Warmer's results of operations and financial condition for all prior periods in which the entertainment group was not consolidated. The selected historical financial data for 1998 reflects: the transfer of cable television systems (or interests therein) serving approximately 650,000 subscribers that were formerly owned by subsidiaries of Time Warner to the TWE-Advance Newhouse Partnership, subject to approximately $1 billion of debt, in exchange for common and preferred interests in the partnership, as well as related transactions, which we refer to as the "TWE- AN Transfers"; and the redemption of Time Warner's series M preferred stock at an aggregate cost of approximately $2.1 billion, using proceeds from the issuance of lower-cost debt. . The selected historical financial data for 1996 reflects: the use of approximately $1.55 billion of net proceeds from the issuance of Time Warner's series M preferred stock to reduce outstanding indebtedness; and the acquisitions of Tuner Broadcasting System, Inc. and Cablevision Industries Corporation and related companies, resulting in: the issuance of an aggregate 6.3 million shares of Time Wamer preferred stock having a total liquidation preference of $633 million and 365.4 million shares of Time Wamer common stock; and the assumption or incwrence of approximately $4.8 billion of indebtedness. The selected historical financial data for 1995 reflects: Time Warner's acquisitions of KBLCOM Incorporated and Summit Communications Group, Inc.; and the exchange by Toshiba Corporation and ITOCHU Corporation of their direct and indirect interests in TWE, resulting in: . the issuance of an aggregate 29.3 million shares of Time Wamer preferred stock having a total liquidation preference of $2.926 billion and 5.2 million shares of Time Warner common stock; and the assumption or incurrence of approximately $1.3 billion of indebtedness. Per common share amounts and average common shares give effect to the two-for-one common stock split that occured on December 15, 1998. Statements of Operations and Cash Flows Data: Three Months Ended March 31, Years Ended December 31, 1998 2000 1999 1999 Pro 1998 1997 1996 1995 Historical Historical Historical Forma Historical Historical Historical Historical (in millions, except per share amounts) $ 6,549 $ 6,091 $ 27,333 $ 26,244 $ 14,582 $ 13.294 $10,064 $8,067 841 935 6,051 3.122 1.486 1.241 897 619 Revenues Business segment operating income Equity in pretax income of entertainment group Interest and other net Encome (Loss) before extraordinary (808) (506) (1,913) (2.040) 356 (1.118) 686 (943) 290 (1,033) 256 (788) (96) (96) 138 138 1,960 1.948 168 168 168 168 301 246 (156) (191) (124) (166) (101) 120 1.896 (372) (372) (73) (448) (218) $ (0.08) $ 0.10 $ (0.08) $ 0.10 $ 0.045 $ 0.045 $ 1.50 $ (0.31) $ (0.31) $ (0.06) $ (0.52) $ 1.42 S (0.31) $ (0.31) $ (0.06) S (0.52) $ 0.18 $ 0.18 $ 0.18 $ 0.18 $ 0.18 S (0.28) $(0.28) $ 0.18 Net income (loss) Net income (loss) applicable to common shares (after preferred dividends) Per share of common stock: Basic net income (loss) Diluted net income (loss) Dividends Average common shares: Basic Diluted Cash provided by operations Cash provided (used) by investing activities Cash provided (used) by financing activities EBITDA 1.301.5 1,301.5 399 1.243.1 1,243.1 816 1,267.0 1,398.3 3.953 1.194.7 1.194.7 3,408 1,194.7 1,194.7 1,845 1.135.4 1.135.4 1.408 862.4 862.4 253 767.6 767.6 1,051 (660) (389) (1.930) (908) 353 (45) (424) (271) (175) (248) $ 1.520 (1.181) (2.938) (2.401) $ 8,561 $ 5.738 $ 2,645 (1.232) $ 2,516 (500) $ 1.866 123 $1.159 $ 1.479 EBITDA consists of business segment operating income (Loss) before depreciation and amortization. Time Wamer considers EBITDA to be an important indicator of the operational strength and performance of its businesses, including the ability to provide cash flows to service debt and fund capital expenditures EBITDA, however, should not be considered an alternative to operating or net income as an indicator of the performance of Time Warner, or as an alternative to cash flows from operating activities as a measure of liquidity, in each case determined in accordance with generally accepted accounting principles. In addition, this definition of EBITDA may not be comparable to similarly titled measures reported by other companies. Significant Events Affecting Time Warner's Operating Trends. The comparability of Time Warner's operating results is affected by a number of significant and nonrecurring items recognized in some periods. For the three months ended March 31, 2000, these items included: net pretax gains of $28 million relating to the sale or exchange of certain cable television systems and investments