

Answered step by step
Verified Expert Solution
Question
1 Approved Answer
The time, in seconds, it takes a random sample of 27 chickens to cross the road is displayed in the histogram. It was determined that
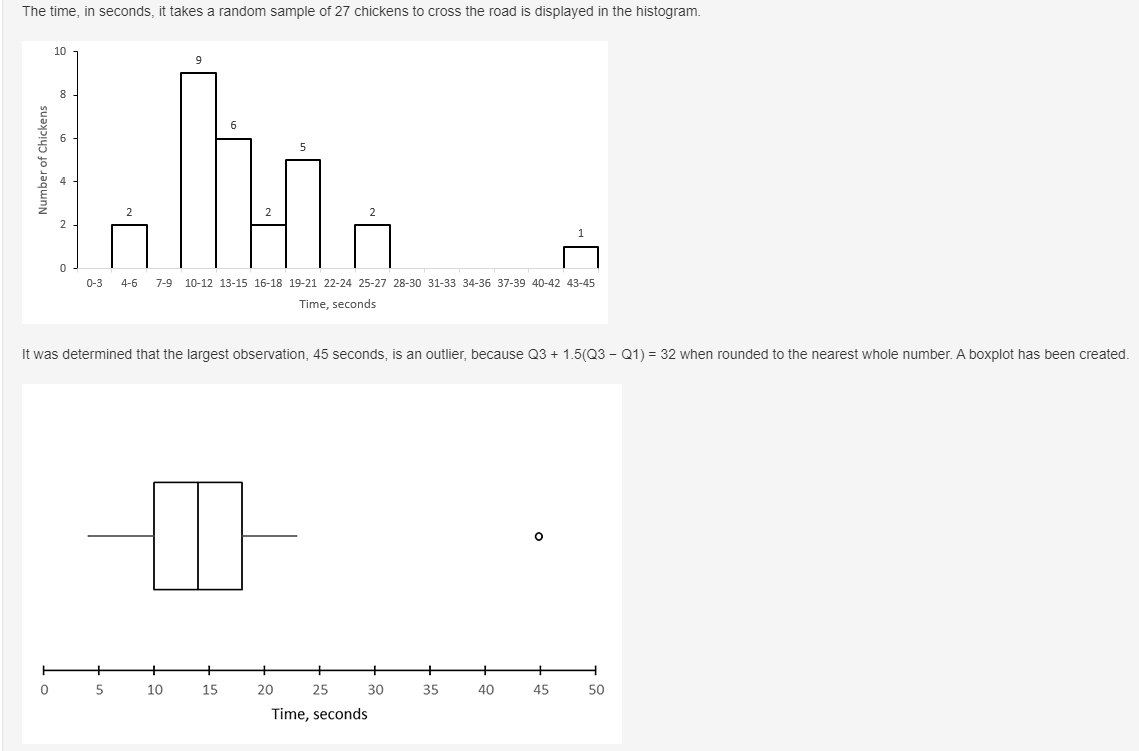
The time, in seconds, it takes a random sample of 27 chickens to cross the road is displayed in the histogram.
It was determined that the largest observation, 45 seconds, is an outlier, because Q3 + 1.5(Q3 ? Q1) = 32 when rounded to the nearest whole number. A boxplot has been created.
Does the boxplot represent the information given in the histogram?
A. Yes
B. No, the boxplot should be skewed right
C. No, the boxplot should be skewed left
D. No, the left whisker should extend to zero
E. No, the right whisker should extend to 45
Step by Step Solution
There are 3 Steps involved in it
Step: 1

Get Instant Access to Expert-Tailored Solutions
See step-by-step solutions with expert insights and AI powered tools for academic success
Step: 2

Step: 3
Ace Your Homework with AI
Get the answers you need in no time with our AI-driven, step-by-step assistance
Get Started