The Toliza Museum of Art In early 2009, Juan Antonio Jimenez has just begun his new position as Executive Director of the Toliza Museum
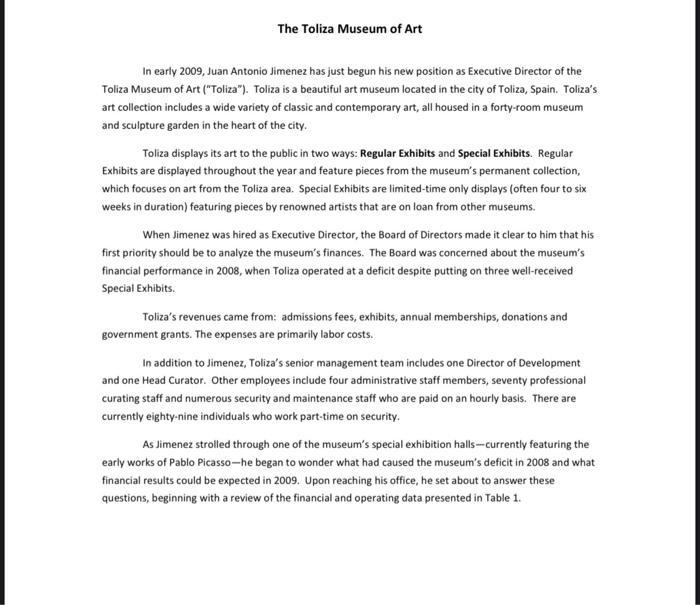
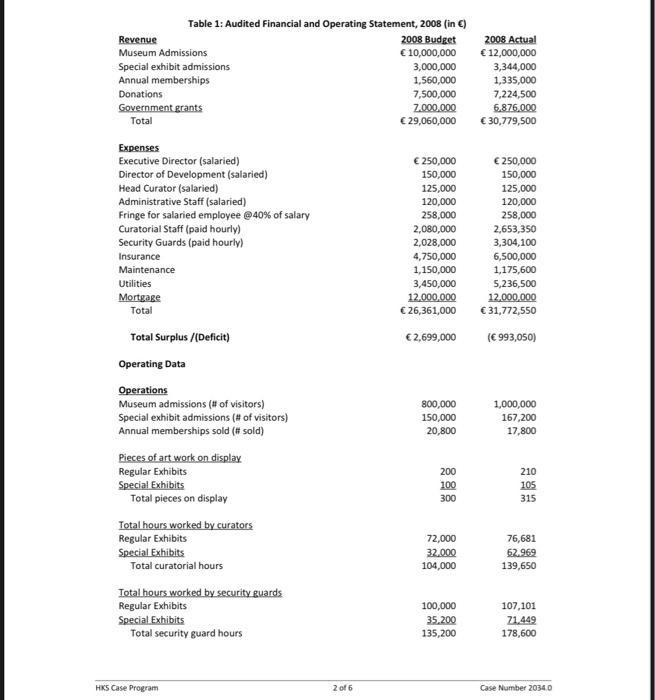
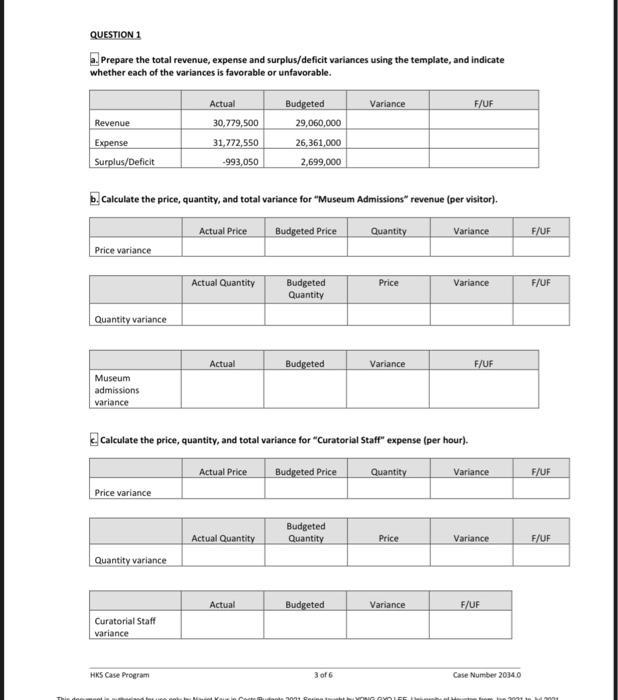
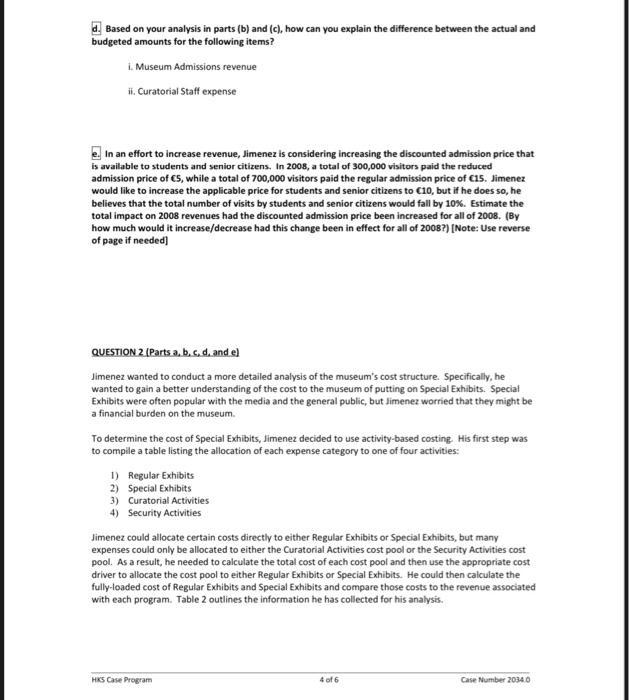
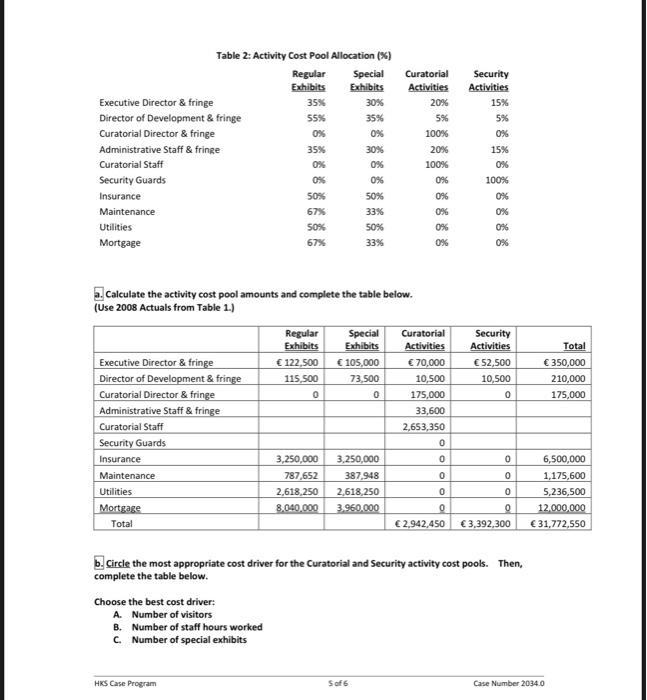
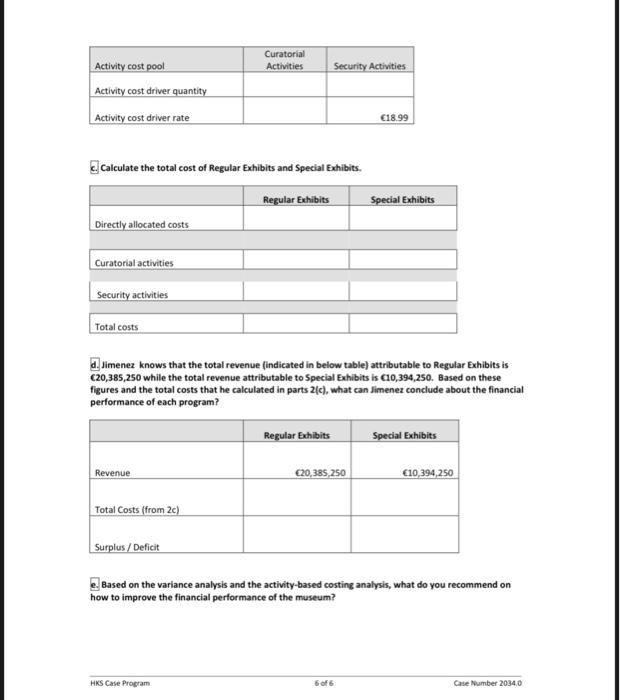
The Toliza Museum of Art In early 2009, Juan Antonio Jimenez has just begun his new position as Executive Director of the Toliza Museum of Art ("Toliza"). Toliza is a beautiful art museum located in the city of Toliza, Spain. Toliza's art collection includes a wide variety of classic and contemporary art, all housed in a forty-room museum and sculpture garden in the heart of the city. Toliza displays its art to the public in two ways: Regular Exhibits and Special Exhibits. Regular Exhibits are displayed throughout the year and feature pieces from the museum's permanent collection, which focuses on art from the Toliza area. Special Exhibits are limited-time only displays (often four to six weeks in duration) featuring pieces by renowned artists that are on loan from other museums. When Jimenez was hired as Executive Director, the Board of Directors made it clear to him that his first priority should be to analyze the museum's finances. The Board was concerned about the museum's financial performance in 2008, when Toliza operated at a deficit despite putting on three well-received Special Exhibits. Toliza's revenues came from: admissions fees, exhibits, annual memberships, donations and government grants. The expenses are primarily labor costs. In addition to Jimenez, Toliza's senior management team includes one Director of Development and one Head Curator. Other employees include four administrative staff members, seventy professional curating staff and numerous security and maintenance staff who are paid on an hourly basis. There are currently eighty-nine individuals who work part-time on security. As Jimenez strolled through one of the museum's special exhibition halls-currently featuring the early works of Pablo Picasso-he began to wonder what had caused the museum's deficit in 2008 and what financial results could be expected in 2009. Upon reaching his office, he set about to answer these questions, beginning with a review of the financial and operating data presented in Table 1. Table 1: Audited Financial and Operating Statement, 2008 (in ) 2008 Budget 10,000,000 2008 Actual 12,000,000 3,344,000 1,335,000 7,224,500 6.876.000 Revenue Museum Admissions Special exhibit admissions Annual memberships 3,000,000 1,560,000 Donations 7,500,000 Government grants Total Z.00.000 29,060,000 30,779,500 Expenses 250,000 250,000 Executive Director (salaried) Director of Development (salaried) Head Curator (salaried) 150,000 150,000 125,000 125,000 Administrative Staff (salaried) Fringe for salaried employee @40% of salary 120,000 120,000 258,000 258,000 Curatorial Staff (paid hourly) 2,080,000 2,028,000 2,653,350 3,304,100 6,500,000 1,175,600 Security Guards (paid hourly) Insurance 4,750,000 Maintenance 1,150,000 Utilities 3,450,000 5,236,500 Mortgage Total 12.000,000 12,000,000 26,361,000 31,772,550 Total Surplus /(Deficit) 2,699,000 ( 993,050) Operating Data Operations Museum admissions (# of visitors) 800,000 150,000 1,000,000 Special exhibit admissions (# of visitors) Annual memberships sold (# sold) 167,200 20,800 17,800 Pieces of art work on display Regular Exhibits Special Exhibits 200 210 100 105 Total pieces on display 300 315 Total hours worked by curators Regular Exhibits Special Exhibits 72,000 76,681 62.969 32.000 104,000 Total curatorial hours 139,650 Total hours worked by security guards Regular Exhibits 100,000 107,101 Special Exhibits Total security guard hours 35.200 135,200 21.449 178,600 HKS Case Program 2 of 6 Case Number 2034.0 QUESTION 1 a Prepare the total revenue, expense and surplus/deficit variances using the template, and indicate whether each of the variances is favorable or unfavorable. Actual Budgeted Variance F/UF Revenue 30,779,500 29,060,000 Expense 31,772,550 26,361,000 Surplus/Deficit -993,050 2,699,000 b. Calculate the price, quantity, and total variance for "Museum Admissions" revenue (per visitor). Actual Price Budgeted Price Quantity Variance F/UF Price variance Actual Quantity F/UF Budgeted Quantity Price Variance Quantity variance Actual Budgeted Variance F/UF Museum admissions variance Calculate the price, quantity, and total variance for "Curatorial Staff" expense (per hour). Actual Price Budgeted Price Quantity Variance F/UF Price variance Budgeted Quantity Actual Quantity Price Variance F/UF Quantity variance Actual Budgeted Variance F/UF Curatorial Staff variance HKS Case Program 3 of 6 Case Number 2034.0 Tom n 01 e m d. Based on your analysis in parts (b) and (c), how can you explain the difference between the actual and budgeted amounts for the following items? i. Museum Admissions revenue i. Curatorial Staff expense In an effort to increase revenue, Jimenez is considering increasing the discounted admission price that is available to students and senior citizens. In 2008, a total of 300,000 visitors paid the reduced admission price of CS, while a total of 700,000 visitors paid the regular admission price of C15. Jimenez would like to increase the applicable price for students and senior citizens to C10, but if he does so, he believes that the total number of visits by students and senior citizens would fall by 10%. Estimate the total impact on 2008 revenues had the discounted admission price been increased for all of 2008. (By how much would it increase/decrease had this change been in effect for all of 2008?) (Note: Use reverse of page if needed) QUESTION 2 (Parts.a, b. s.d.and e) Jimenez wanted to conduct a more detailed analysis of the museum's cost structure. Specifically, he wanted to gain a better understanding of the cost to the museum of putting on Special Exhibits. Special Exhibits were often popular with the media and the general public, but Jimenez worried that they might be a financial burden on the museum. To determine the cost of Special Exhibits, Jimenez decided to use activity-based costing. His first step was to compile a table listing the allocation of each expense category to one of four activities: 1) Regular Exhibits 2) Special Exhibits 3) Curatorial Activities 4) Security Activities Jimenez could allocate certain costs directly to either Regular Exhibits or Special Exhibits, but many expenses could only be allocated to either the Curatorial Activities cost pool or the Security Activities cost pool. As a result, he needed to calculate the total cost of each cost pool and then use the appropriate cost driver to allocate the cost pool to either Regular Exhibits or Special Exhibits. He could then calculate the fully-loaded cost of Regular Exhibits and Special Exhibits and compare those costs to the revenue associated with each program. Table 2 outlines the information he has collected for his analysis. HKS Case Program 4 of 6 Case Number 2034.0 Table 2: Activity Cost Pool Allocation (%) Regular Exhibits Special Exhibits Curatorial Security Activities Activities Executive Director & fringe 35% 30% 20% 15% Director of Development & fringe 55% 35% 5% 5% Curatorial Director & fringe Administrative Staff & fringe 0% 0% 100% 0% 35% 30% 20% 15% Curatorial Staff 0% 0% 100% O% Security Guards 0% 0% 0% 100% Insurance 50% 50% 0% 0% Maintenance 67% 33% 0% 0% Utilities S0% 50% 0% 0% Mortgage 67% 33% 0% 0% Calculate the activity cost pool amounts and complete the table below. (Use 2008 Actuals from Table 1.) Regular Exhibits 122,500 Curatorial Special Exhibits Security Activities 70,000 Activities Total Executive Director & fringe Director of Development & fringe Curatorial Director & fringe 105,000 52,500 350,000 115,500 73,500 10,500 10,500 210,000 175,000 175,000 Administrative Staff & fringe 33,600 Curatorial Staff 2,653,350 Security Guards Insurance 3,250,000 3,250,000 6,500,000 Maintenance 787,652 387,948 1,175,600 2,618,250 3.960,000 Utilities 2,618,250 5,236,500 Mortgage Total 8.040.000 12.000,000 2,942,450 3,392,300 31,772,550 b. Circle the most appropriate cost driver for the Curatorial and Security activity cost pools. Then, complete the table below. Choose the best cost driver: A. Number of visitors B. Number of staff hours worked C. Number of special exhibits HKS Case Program Sof 6 Case Number 2034.0 Curatorial Activity cost pool Activities Security Activities Activity cost driver quantity Activity cost driver rate 18.99 Calculate the total cost of Regular Exhibits and Special Exhibits. Regular Exhibits Special Exhibits Directly allocated costs Curatorial activities Security activities Total costs d. Jimenez knows that the total revenue (indicated in below table) attributable to Regular Exhibits is C20,385,250 while the total revenue attributable to Special Exhibits is C10,394,250. Based on these figures and the total costs that he calculated in parts 2(c), what can Jimenez conclude about the financial performance of each program? Regular Exhibits Special Exhibits Revenue C20,385,250 C10,394,250 Total Costs (from 2c) Surplus / Deficit Based on the variance analysis and the activity-based costing analysis, what do you recommend on how to improve the financial performance of the museum? HKS Case Program 6of6 Case Number 2034.0
Step by Step Solution
3.41 Rating (151 Votes )
There are 3 Steps involved in it
Step: 1

See step-by-step solutions with expert insights and AI powered tools for academic success
Step: 2

Step: 3

Ace Your Homework with AI
Get the answers you need in no time with our AI-driven, step-by-step assistance
Get Started


