

Question
The total 2004 2004 US employment status of the?non-institutional adult population is depicted in the figure on the right. It is measured in millions of
The total 2004
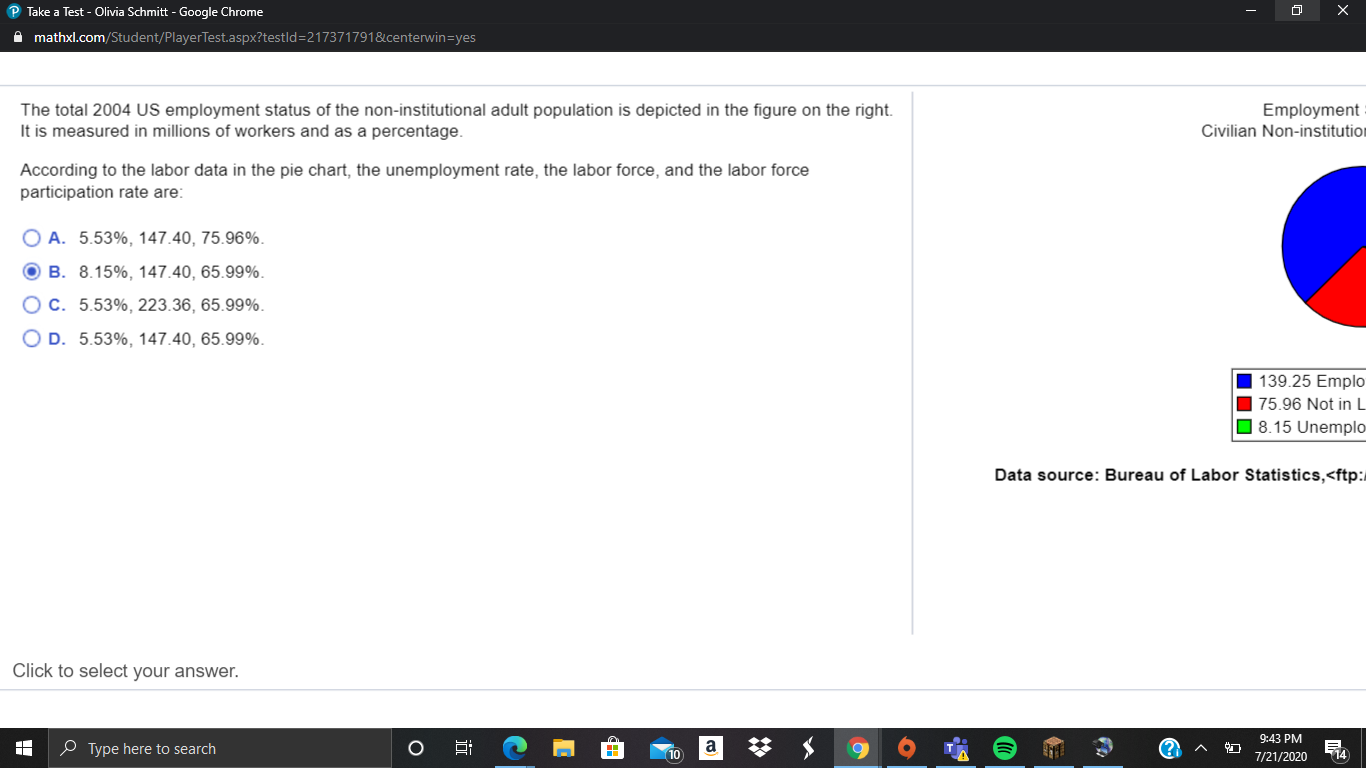
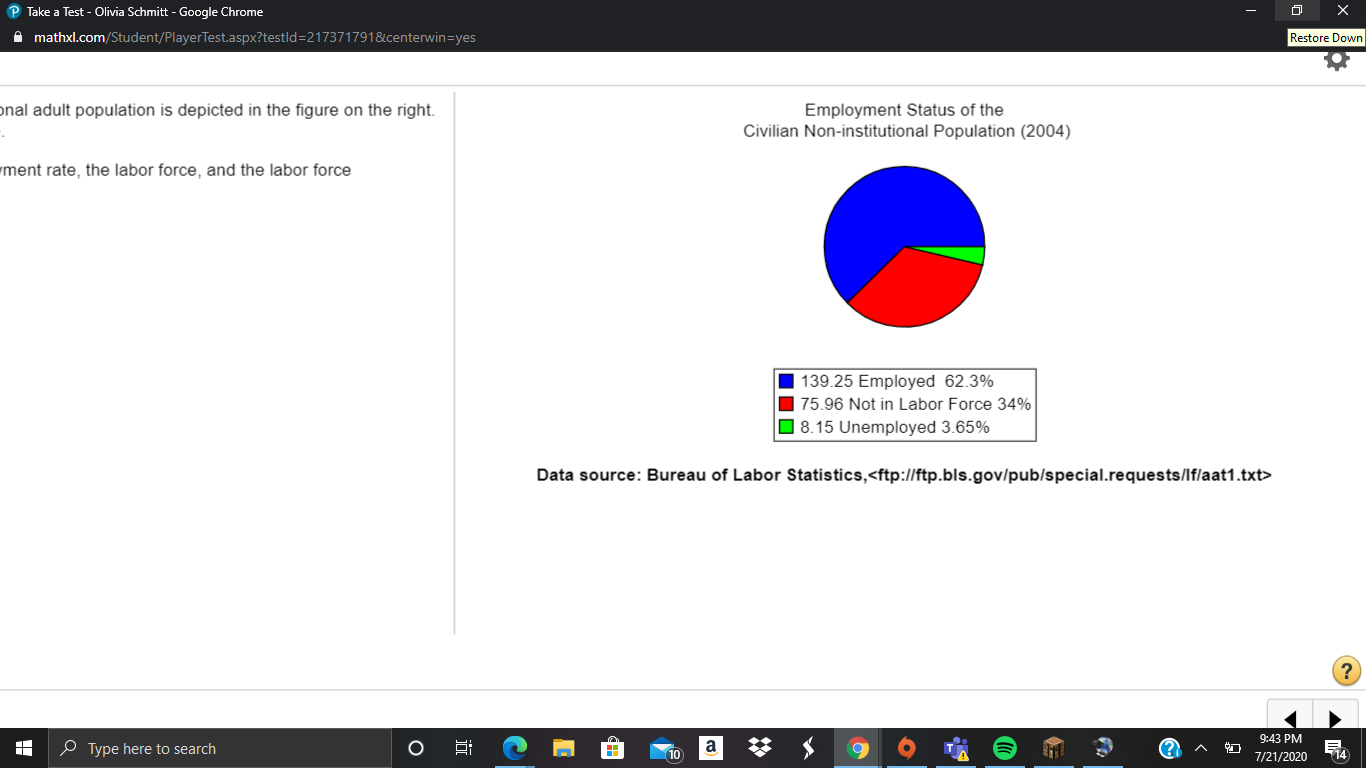
2004 US employment status of the?non-institutional adult population is depicted in the figure on the right. It is measured in millions of workers and as a percentage.
According to the labor data in the pie?chart, the unemployment?rate, the labor?force, and the labor force participation rate?are:
A.
5.53
5.53?%, 147.40
147.40?, 75.96
75.96?%.
B.
8.15
8.15?%, 147.40
147.40?, 65.99
65.99?%.
C.
5.53
5.53?%, 223.36
223.36?, 65.99
65.99?%.
D.
5.53
5.53?%, 147.40
147.40?, 65.99
65.99?%.
Step by Step Solution
There are 3 Steps involved in it
Step: 1

Get Instant Access to Expert-Tailored Solutions
See step-by-step solutions with expert insights and AI powered tools for academic success
Step: 2

Step: 3
Ace Your Homework with AI
Get the answers you need in no time with our AI-driven, step-by-step assistance
Get Started
Managerial Economics A Problem-Solving Approach
Authors: Luke M. Froeb, Brain T. Mccann
2nd Edition
B00BTM8FK0