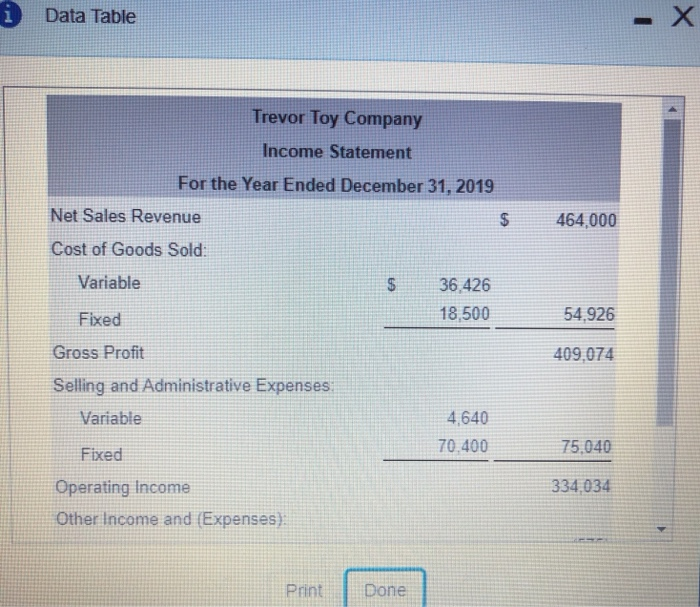
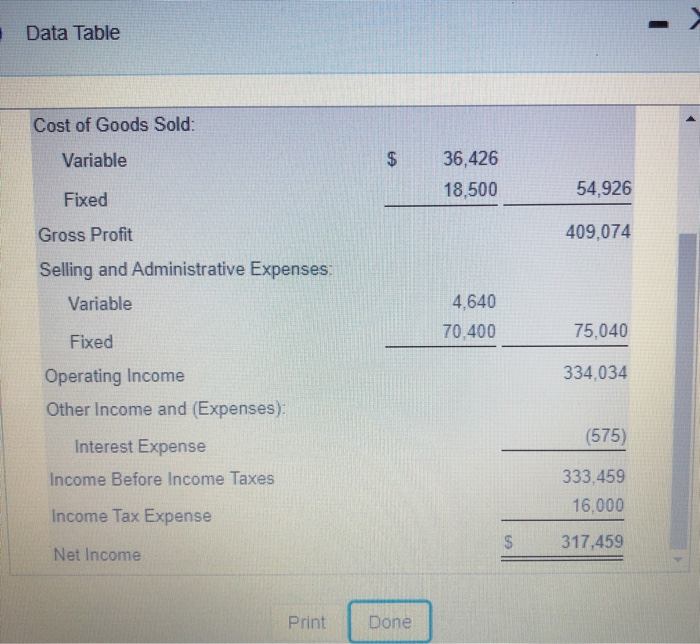
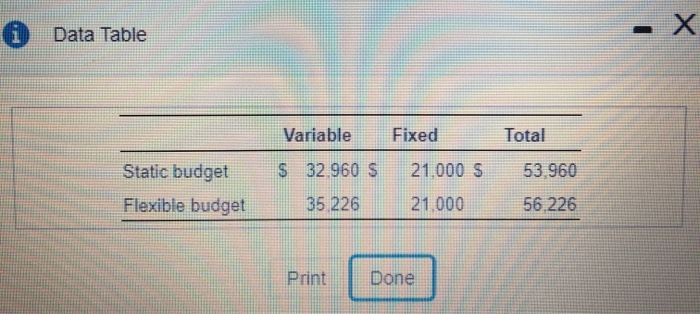
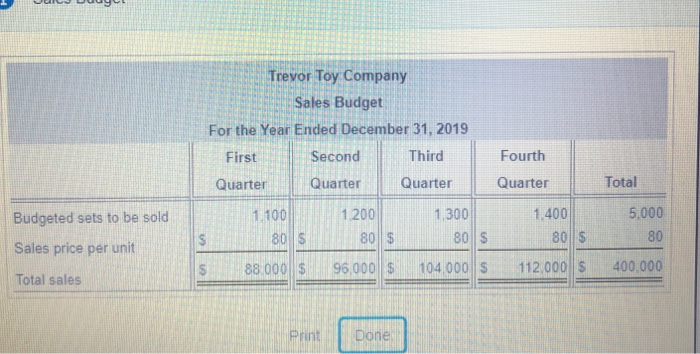
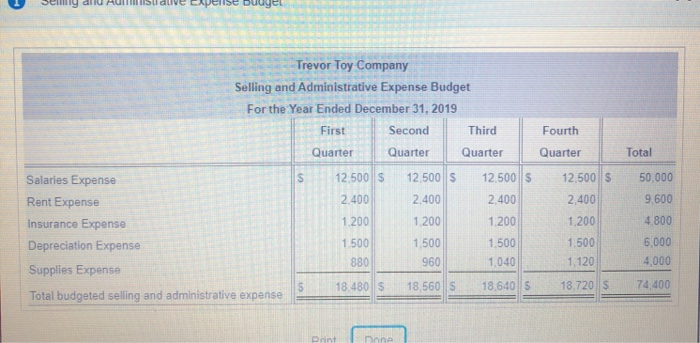
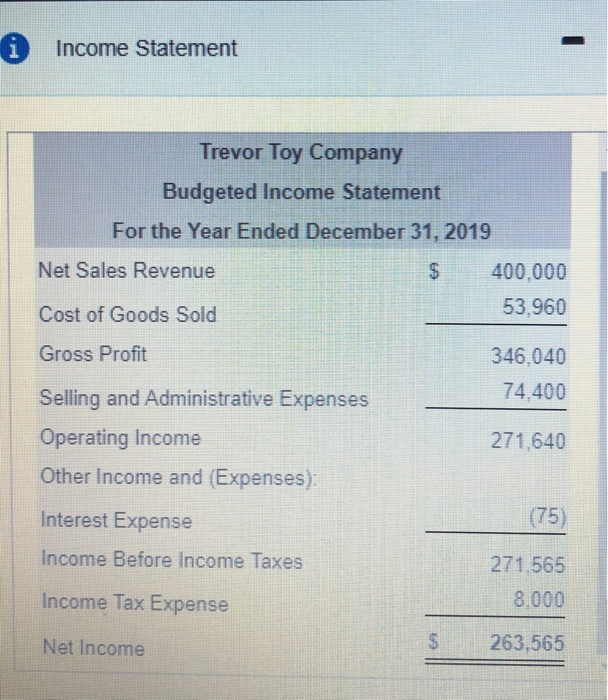
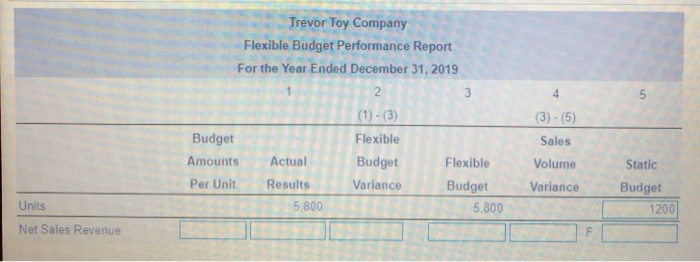
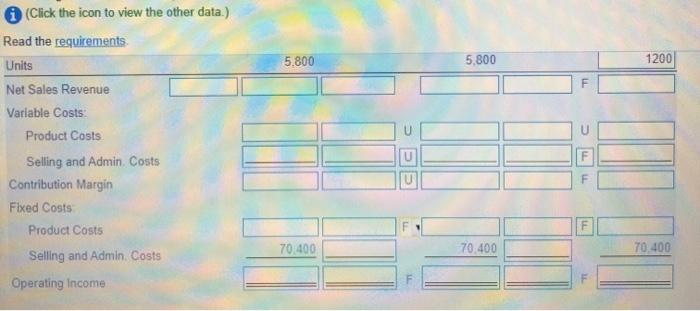
The Trevor Toy Company manufactures toy building block sets for children. Trevor is planning for 2019 by developing a master budget by quarters Trevor's balance sheet for December 31, 2018, follow (Click the icon to view the balance sheet) Other budget data for Trevor Toy Company (Click the icon to view the other data) Read the requirements Requirement 3. Trevor sold 5,800 sets in 2019, and its actual operating income was as follows: (Click the icon to view the actual income statement) Prepare a flexible budget performance report through operating income for 2019 Show product costs separately from seling and administrative con To simply the calkulations due to set in beginning inventory having different cost than those produced and sold in 2019. assume the following productos m (Click the icon to view the product costs) Review the sales budgets Redbo Review the seling and datterens buds.boxe Review the income statement you down (Label each variances as favorable (F) or unfavorable (U) Enter for any zero balances. For any 50 variances leave the favorable Favorable (U) input bilan) Trevor Toy Company Flexible Budget Performance Report For the Year Ended December 31, 2019 Data Table Trevor Toy Company Income Statement $ 464,000 For the Year Ended December 31, 2019 Net Sales Revenue Cost of Goods Sold: Variable $ 36 426 Fixed 18,500 54.926 Gross Profit 409,074 Selling and Administrative Expenses Variable 4,640 70.400 Fixed 75,040 334,034 Operating Income Other Income and (Expenses) Print Done Data Table Cost of Goods Sold: Variable $ 36,426 18,500 54,926 Fixed Gross Profit 409,074 Selling and Administrative Expenses: Variable 4,640 70.400 75,040 Fixed 334,034 Operating Income Other Income and (Expenses): Interest Expense Income Before Income Taxes (575) 333,459 16,000 Income Tax Expense $ 317,459 Net Income Print Done Data Table x Variable Fixed Total $32.960 $ 21,000 $ 53.960 Static budget Flexible budget 35 226 21,000 56 226 Print Done Trevor Toy Company Sales Budget For the Year Ended December 31, 2019 First Second Third Quarter Quarter Quarter Fourth Quarter Total Budgeted sets to be sold 1.100 80S 1200 80 $ 1,300 80S 1.400 80$ 5.000 80 S Sales price per unit $ 88.000 $ 96.000||$ 104 000 $ 112.000 6 400,000 Total sales Print Done budger Trevor Toy Company Selling and Administrative Expense Budget For the Year Ended December 31, 2019 First Second Third Quarter Quarter Quarter Fourth Quarter Total $ 12 500 $ 12.500 S 12.500 12,500 $ 2.400 2.400 2.400 2.400 Salaries Expense Rent Expense Insurance Expense Depreciation Expense Supplies Expense 50,000 9.600 4.800 1.200 1.200 1.200 1.200 1.500 1.500 880 1.500 960 1.500 1.040 6.000 4,000 1.120 S 18.480 S 18,560 18.640 S 18.7205 74.400 Total budgeted selling and administrative expense Drint ne i Income Statement Trevor Toy Company Budgeted Income Statement For the Year Ended December 31, 2019 Net Sales Revenue $ 400,000 Cost of Goods Sold 53.960 Gross Profit 346.040 74.400 Selling and Administrative Expenses Operating Income Other Income and (Expenses): 271,640 Interest Expense (75) Income Before Income Taxes 271.565 8.000 Income Tax Expense Net Income $ 263,565 4 5 Trevor Toy Company Flexible Budget Performance Report For the Year Ended December 31, 2019 2 (1)-(3) Budget Flexible Amounts Actual Budget Flexible Per Unit Results Variance Budget 5,800 5,800 (3) - (5) Sales Volume Variance Static Budget 1200 Units Net Sales Revenue 5,800 5,800 1200 F (Click the icon to view the other data.) Read the requirements Units Net Sales Revenue Variable Costs Product Costs Selling and Admin Costs Contribution Margin Fixed Costs Product Costs U U 70.400 70,400 70 400 Selling and Admin Costs Operating Income F

