

Answered step by step
Verified Expert Solution
Question
1 Approved Answer
The two companies that I chose are Walmart and Target. The issue I am having is learning to use the websites to find the numbers
The two companies that I chose are Walmart and Target. The issue I am having is learning to use the websites to find the numbers for the excel spreadsheet. Please help.
Im sorry, Im not understanding what needs to be added to the question. I only can add the websites that are included in tje structions. Is that what you are referencing?
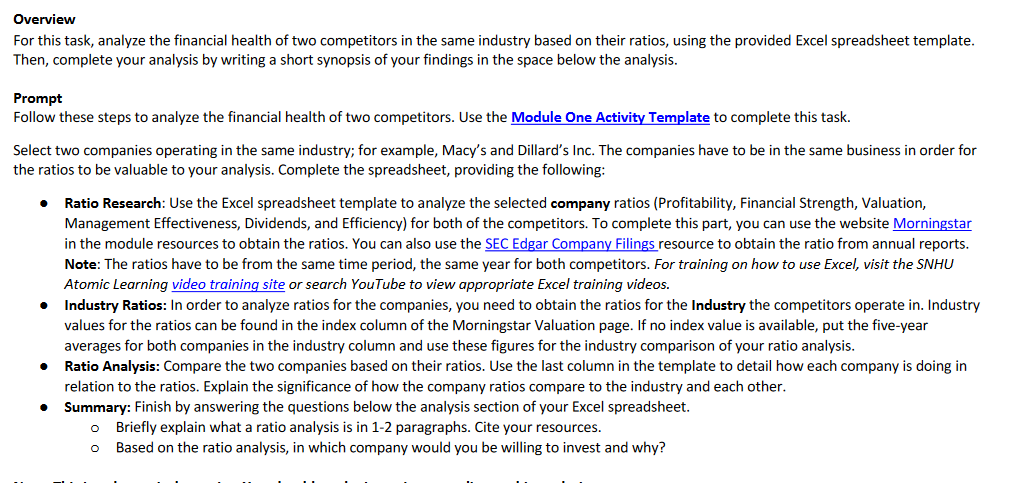
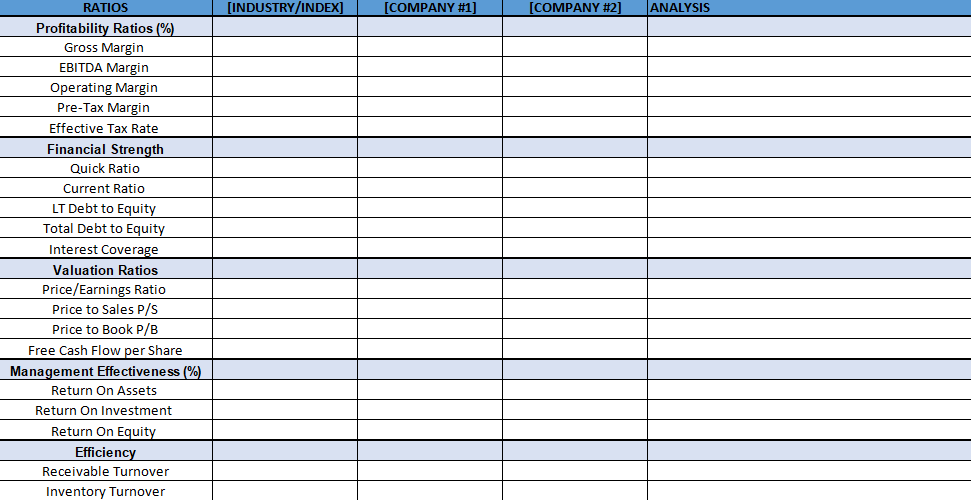
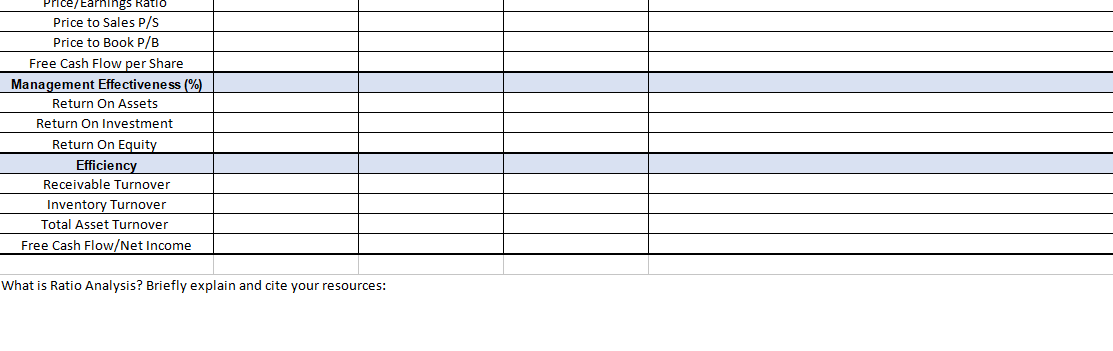
Overview For this task, analyze the financial health of two competitors in the same industry based on their ratios, using the provided Excel spreadsheet template. Then, complete your analysis by writing a short synopsis of your findings in the space below the analysis. Prompt Follow these steps to analyze the financial health of two competitors. Use the Module One Activity Template to complete this task. Select two companies operating in the same industry; for example, Macy's and Dillard's Inc. The companies have to be in the same business in order for the ratios to be valuable to your analysis. Complete the spreadsheet, providing the following: Ratio Research: Use the Excel spreadsheet template to analyze the selected company ratios (Profitability, Financial Strength, Valuation, Management Effectiveness, Dividends, and Efficiency) for both of the competitors. To complete this part, you can use the website Morningstar in the module resources to obtain the ratios. You can also use the SEC Edgar Company Filings resource to obtain the ratio from annual reports. Note: The ratios have to be from the same time period, the same year for both competitors. For training on how to use Excel, visit the SNHU Atomic Learning video training site or search YouTube to view appropriate Excel training videos. Industry Ratios: In order to analyze ratios for the companies, you need to obtain the ratios for the Industry the competitors operate in. Industry values for the ratios can be found in the index column of the Morningstar Valuation page. If no index value is available, put the five-year averages for both companies in the industry column and use these figures for the industry comparison of your ratio analysis. Ratio Analysis: Compare the two companies based on their ratios. Use the last column in the template to detail how each company is doing in relation to the ratios. Explain the significance of how the company ratios compare to the industry and each other. Summary: Finish by answering the questions below the analysis section of your Excel spreadsheet. O Briefly explain what a ratio analysis is in 1-2 paragraphs. Cite your resources. o Based on the ratio analysis, in which company would you be willing to invest and why? [INDUSTRY/INDEX] [COMPANY #1] [COMPANY #2] ANALYSIS RATIOS Profitability Ratios (%) Gross Margin EBITDA Margin Operating Margin Pre-Tax Margin Effective Tax Rate Financial Strength Quick Ratio Current Ratio LT Debt to Equity Total Debt to Equity Interest Coverage Valuation Ratios Price/Earnings Ratio Price to Sales P/S Price to Book P/B Free Cash Flow per Share Management Effectiveness (%) Return On Assets Return On Investment Return On Equity Efficiency Receivable Turnover Inventory Turnover Price/Earnings Ratio Price to Sales P/S Price to Book P/B Free Cash Flow per Share Management Effectiveness (%) Return On Assets Return On Investment Return On Equity Efficiency Receivable Turnover Inventory Turnover Total Asset Turnover Free Cash Flow/Net Income What is Ratio Analysis? Briefly explain and cite your resources: Overview For this task, analyze the financial health of two competitors in the same industry based on their ratios, using the provided Excel spreadsheet template. Then, complete your analysis by writing a short synopsis of your findings in the space below the analysis. Prompt Follow these steps to analyze the financial health of two competitors. Use the Module One Activity Template to complete this task. Select two companies operating in the same industry; for example, Macy's and Dillard's Inc. The companies have to be in the same business in order for the ratios to be valuable to your analysis. Complete the spreadsheet, providing the following: Ratio Research: Use the Excel spreadsheet template to analyze the selected company ratios (Profitability, Financial Strength, Valuation, Management Effectiveness, Dividends, and Efficiency) for both of the competitors. To complete this part, you can use the website Morningstar in the module resources to obtain the ratios. You can also use the SEC Edgar Company Filings resource to obtain the ratio from annual reports. Note: The ratios have to be from the same time period, the same year for both competitors. For training on how to use Excel, visit the SNHU Atomic Learning video training site or search YouTube to view appropriate Excel training videos. Industry Ratios: In order to analyze ratios for the companies, you need to obtain the ratios for the Industry the competitors operate in. Industry values for the ratios can be found in the index column of the Morningstar Valuation page. If no index value is available, put the five-year averages for both companies in the industry column and use these figures for the industry comparison of your ratio analysis. Ratio Analysis: Compare the two companies based on their ratios. Use the last column in the template to detail how each company is doing in relation to the ratios. Explain the significance of how the company ratios compare to the industry and each other. Summary: Finish by answering the questions below the analysis section of your Excel spreadsheet. O Briefly explain what a ratio analysis is in 1-2 paragraphs. Cite your resources. o Based on the ratio analysis, in which company would you be willing to invest and why? [INDUSTRY/INDEX] [COMPANY #1] [COMPANY #2] ANALYSIS RATIOS Profitability Ratios (%) Gross Margin EBITDA Margin Operating Margin Pre-Tax Margin Effective Tax Rate Financial Strength Quick Ratio Current Ratio LT Debt to Equity Total Debt to Equity Interest Coverage Valuation Ratios Price/Earnings Ratio Price to Sales P/S Price to Book P/B Free Cash Flow per Share Management Effectiveness (%) Return On Assets Return On Investment Return On Equity Efficiency Receivable Turnover Inventory Turnover Price/Earnings Ratio Price to Sales P/S Price to Book P/B Free Cash Flow per Share Management Effectiveness (%) Return On Assets Return On Investment Return On Equity Efficiency Receivable Turnover Inventory Turnover Total Asset Turnover Free Cash Flow/Net Income What is Ratio Analysis? Briefly explain and cite your resources Step by Step Solution
There are 3 Steps involved in it
Step: 1

Get Instant Access to Expert-Tailored Solutions
See step-by-step solutions with expert insights and AI powered tools for academic success
Step: 2

Step: 3
Ace Your Homework with AI
Get the answers you need in no time with our AI-driven, step-by-step assistance
Get Started
Yes You Can Get A Financial Life
Authors: Ben Stein, Phil Demuth
1st Edition
1401911250, 978-1401911256