Answered step by step
Verified Expert Solution
Link Copied!

Question

1 Approved Answer

The U.S. Census Bureau provides considerable demographic info that is useful for marketers . Assume that the following table provides a sample of such population
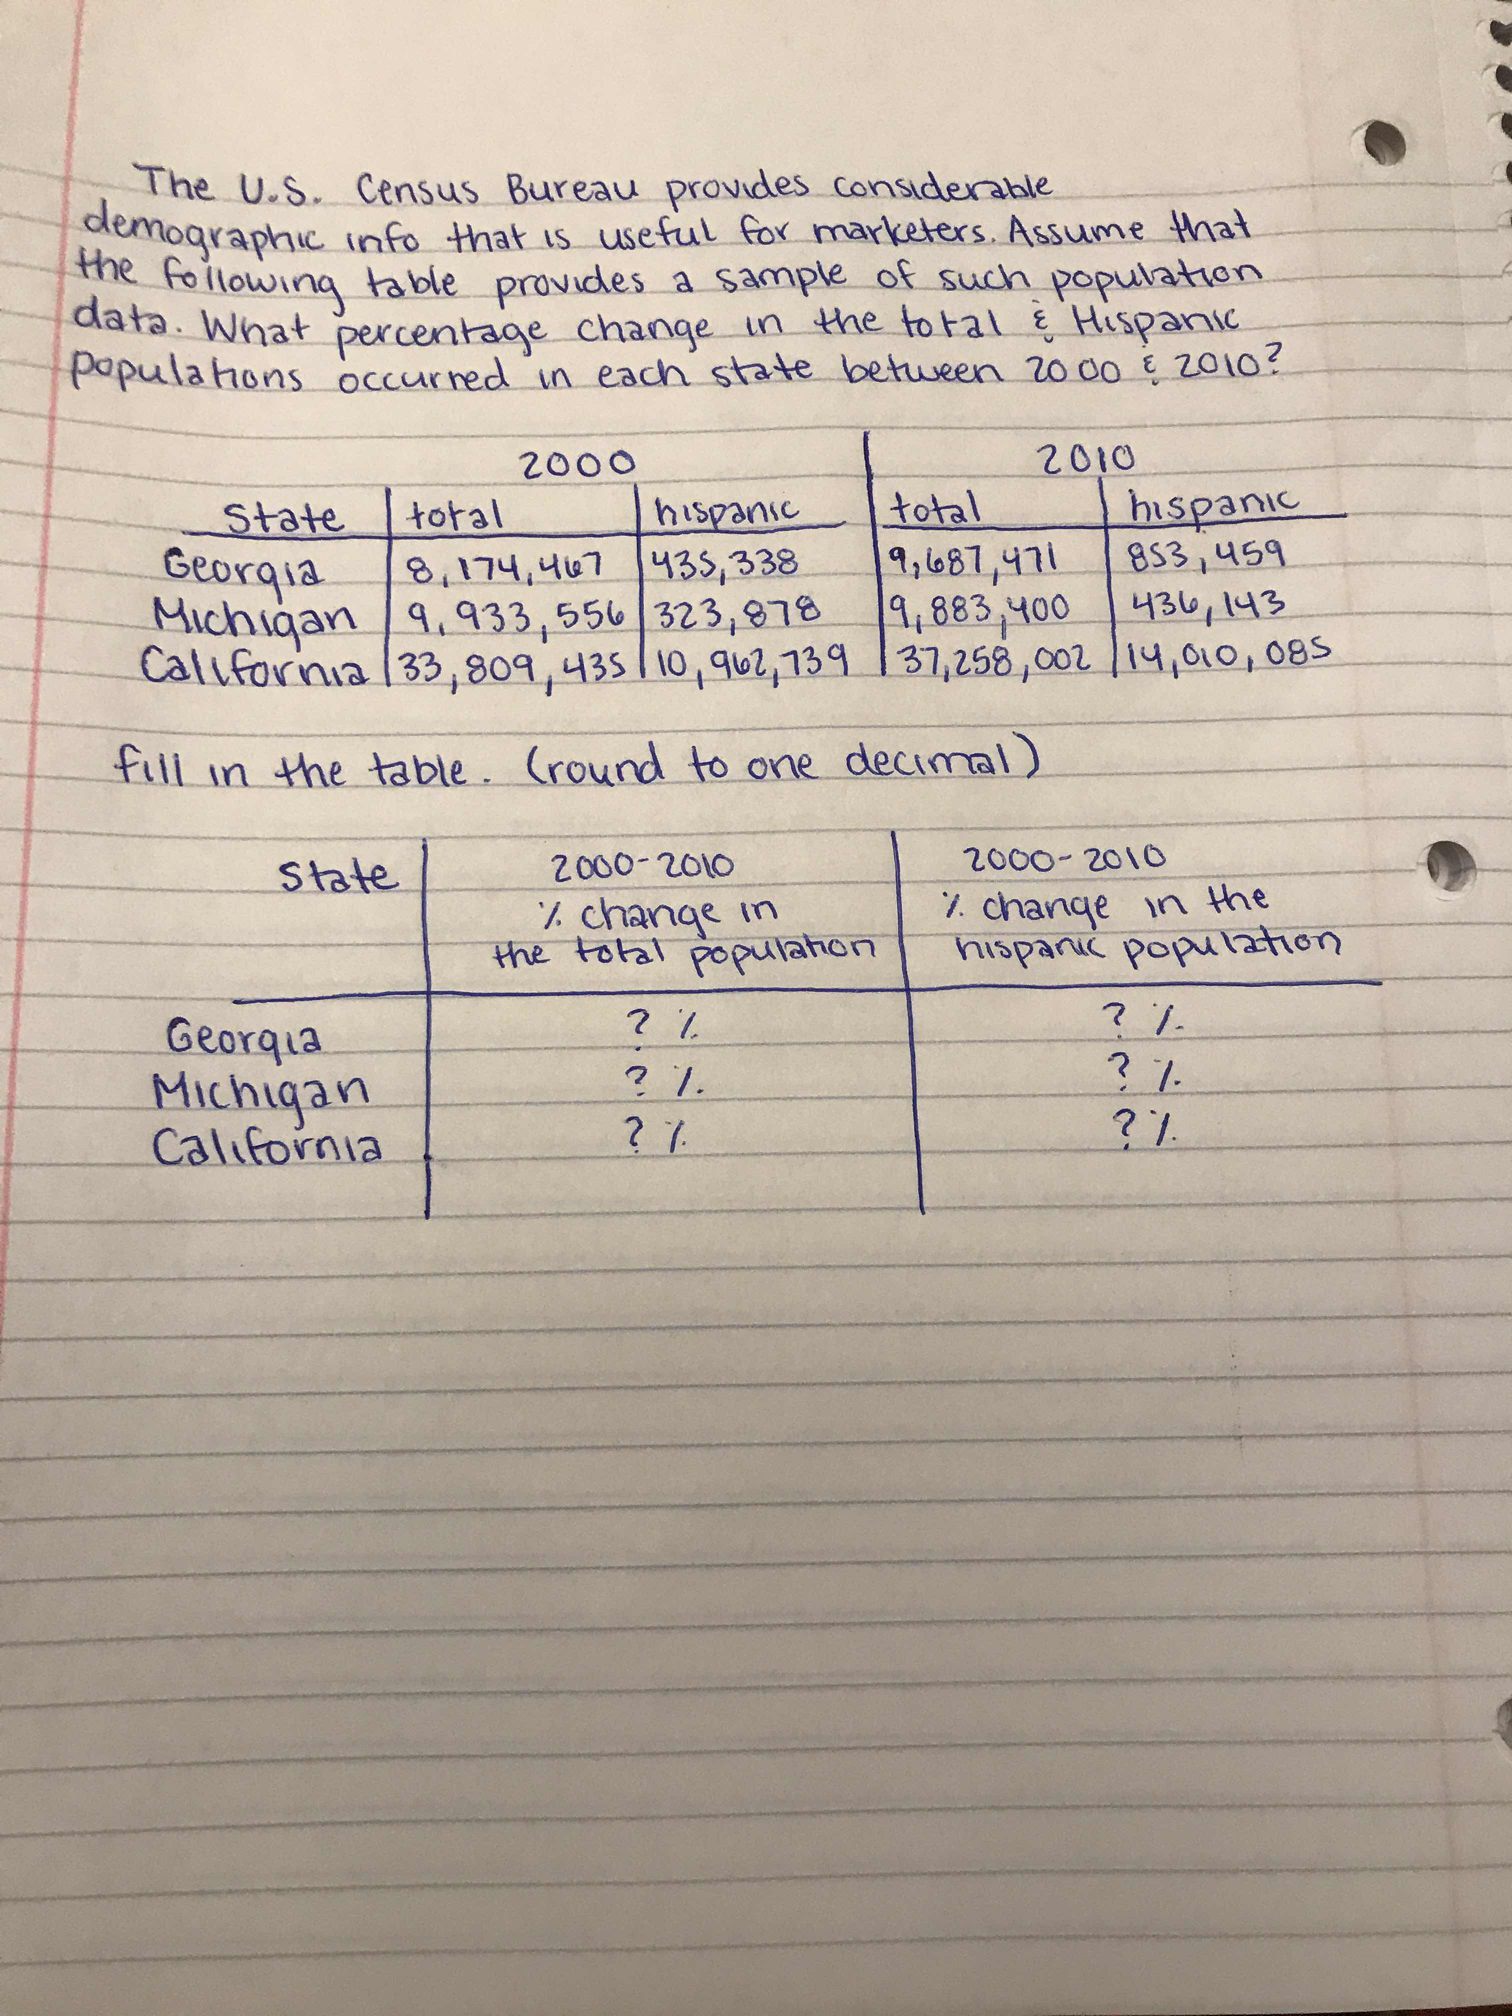
image text in transcribed
The U.S. Census Bureau provides considerable demographic info that is useful for marketers . Assume that the following table provides a sample of such population data. What percentage change in the total & Hispanic populations occurred in each state between 20 00 E 2010? 2000 2010 state total hispanic total hispanic Georgia 8, 174, 467 435, 338 9, 687,471 853, 459 Michigan 9. 933 , 556 323, 878 9, 883 , 400 436, 143 California | 33, 809, 435 / 10, 962, 739 /37, 258, 002/ 14, 010, 085 fill in the table . ( round to one decimal ) state 2000- 2010 2000 - 2010 %. change in 1. change in the the total population hispanic population Georgia ? 1 2 1 . Michigan ? 1. ? 1 . California ? 1

Step by Step Solution

There are 3 Steps involved in it

Step: 1

blur-text-image

Get Instant Access to Expert-Tailored Solutions

See step-by-step solutions with expert insights and AI powered tools for academic success

Step: 2

blur-text-image_2

Step: 3

blur-text-image_3

Ace Your Homework with AI

Get the answers you need in no time with our AI-driven, step-by-step assistance

Get Started

Recommended Textbook for

International Marketing & Export Management

Authors: Gerald Albaum, Edwin Duerr

7th edition

273743880, 978-8131791189, 8131791181, 978-0273743880

More Books

Students also viewed these Marketing questions

Question

Is the equation t 2 y'(t) = (t + 4)/y 2 separable?

Answered: 1 week ago