- The US has a total trade deficit in most categories meaning that the US imports more than it exports, except for agricultural products where the value of US exports of ag products is greater than imports and we have an agricultural trade surplus as a result. Moreover, the US exports a large share of cornbelt agricultural products to EU-zone countries and China. Focus first on the EU and describe what the impact on US agricultural exports would be from the FX rate of Euros/$US declining during the pandemic (explain if you think that European economies would buy more or less ag products from the US as a result use an example with current $/EU or EU/$ FX rates ). If the Ag Sector exports more than it imports, and all other sectors import more than exported, does a weakening dollar favor ag relative to other sectors or the other way around? Explain briefly and use a related example in your explanation.
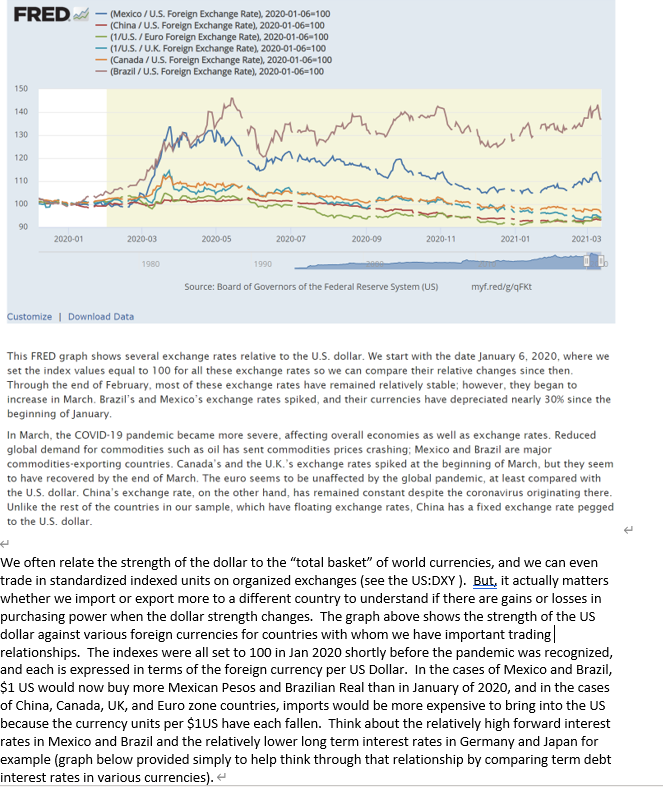
FRED (Mexico /U.S.Foreign Exchange Rate), 2020-01-06-100 (China/U.S. Foreign Exchange Rate), 2020-01-06=100 (1/U.S. / Euro Foreign Exchange Rate), 2020-01-06-100 (1/U.S./U.K. Foreign Exchange Rate), 2020-01-06=100 (Canada / U.S. Foreign Exchange Rate), 2020-01-06-100 (Brazil /U.S. Foreign Exchange Rate), 2020-01-06=100 150 140 130 Anh ilm in 1 ms with 120 110 m 100 many 90 2020-01 2020-03 2020-05 2020-07 2020-09 2020-11 2021-01 2021-03 1980 1990 Source: Board of Governors of the Federal Reserve System (US) myf.red/g/qFKt Customize | Download Data This FRED graph shows several exchange rates relative to the U.S. dollar. We start with the date January 6, 2020, where we set the index values equal to 100 for all these exchange rates so we can compare their relative changes since then. Through the end of February, most of these exchange rates have remained relatively stable; however, they began to increase in March. Brazil's and Mexico's exchange rates spiked, and their currencies have depreciated nearly 30% since the beginning of January In March, the COVID-19 pandemic became more severe, affecting overall economies as well as exchange rates. Reduced global demand for commodities such as oil has sent commodities prices crashing; Mexico and Brazil are major commodities-exporting countries. Canada's and the U.K.'s exchange rates spiked at the beginning of March, but they seem to have recovered by the end of March. The euro seems to be unaffected by the global pandemic, at least compared with the U.S. dollar. China's exchange rate, on the other hand, has remained constant despite the coronavirus originating there. Unlike the rest of the countries in our sample, which have floating exchange rates, China has a fixed exchange rate pegged to the U.S. dollar. We often relate the strength of the dollar to the "total basket" of world currencies, and we can even trade in standardized indexed units on organized exchanges (see the US:DXY). But, it actually matters whether we import or export more to a different country to understand if there are gains or losses in purchasing power when the dollar strength changes. The graph above shows the strength of the US dollar against various foreign currencies for countries with whom we have important trading| relationships. The indexes were all set to 100 in Jan 2020 shortly before the pandemic was recognized, and each is expressed in terms of the foreign currency per US Dollar. In the cases of Mexico and Brazil, $1 US would now buy more Mexican Pesos and Brazilian Real than in January of 2020, and in the cases of China, Canada, UK, and Euro zone countries, imports would be more expensive to bring into the US because the currency units per $1US have each fallen. Think about the relatively high forward interest rates in Mexico and Brazil and the relatively lower long term interest rates in Germany and Japan for example (graph below provided simply to help think through that relationship by comparing term debt interest rates in various currencies). FRED (Mexico /U.S.Foreign Exchange Rate), 2020-01-06-100 (China/U.S. Foreign Exchange Rate), 2020-01-06=100 (1/U.S. / Euro Foreign Exchange Rate), 2020-01-06-100 (1/U.S./U.K. Foreign Exchange Rate), 2020-01-06=100 (Canada / U.S. Foreign Exchange Rate), 2020-01-06-100 (Brazil /U.S. Foreign Exchange Rate), 2020-01-06=100 150 140 130 Anh ilm in 1 ms with 120 110 m 100 many 90 2020-01 2020-03 2020-05 2020-07 2020-09 2020-11 2021-01 2021-03 1980 1990 Source: Board of Governors of the Federal Reserve System (US) myf.red/g/qFKt Customize | Download Data This FRED graph shows several exchange rates relative to the U.S. dollar. We start with the date January 6, 2020, where we set the index values equal to 100 for all these exchange rates so we can compare their relative changes since then. Through the end of February, most of these exchange rates have remained relatively stable; however, they began to increase in March. Brazil's and Mexico's exchange rates spiked, and their currencies have depreciated nearly 30% since the beginning of January In March, the COVID-19 pandemic became more severe, affecting overall economies as well as exchange rates. Reduced global demand for commodities such as oil has sent commodities prices crashing; Mexico and Brazil are major commodities-exporting countries. Canada's and the U.K.'s exchange rates spiked at the beginning of March, but they seem to have recovered by the end of March. The euro seems to be unaffected by the global pandemic, at least compared with the U.S. dollar. China's exchange rate, on the other hand, has remained constant despite the coronavirus originating there. Unlike the rest of the countries in our sample, which have floating exchange rates, China has a fixed exchange rate pegged to the U.S. dollar. We often relate the strength of the dollar to the "total basket" of world currencies, and we can even trade in standardized indexed units on organized exchanges (see the US:DXY). But, it actually matters whether we import or export more to a different country to understand if there are gains or losses in purchasing power when the dollar strength changes. The graph above shows the strength of the US dollar against various foreign currencies for countries with whom we have important trading| relationships. The indexes were all set to 100 in Jan 2020 shortly before the pandemic was recognized, and each is expressed in terms of the foreign currency per US Dollar. In the cases of Mexico and Brazil, $1 US would now buy more Mexican Pesos and Brazilian Real than in January of 2020, and in the cases of China, Canada, UK, and Euro zone countries, imports would be more expensive to bring into the US because the currency units per $1US have each fallen. Think about the relatively high forward interest rates in Mexico and Brazil and the relatively lower long term interest rates in Germany and Japan for example (graph below provided simply to help think through that relationship by comparing term debt interest rates in various currencies)