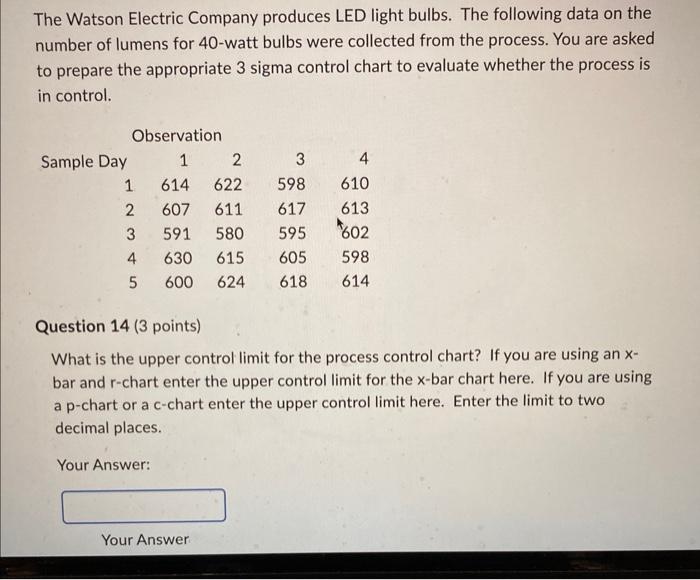
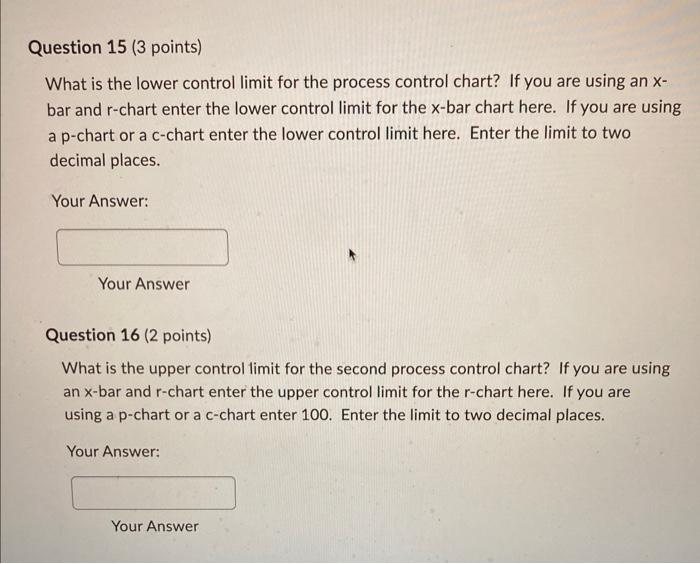
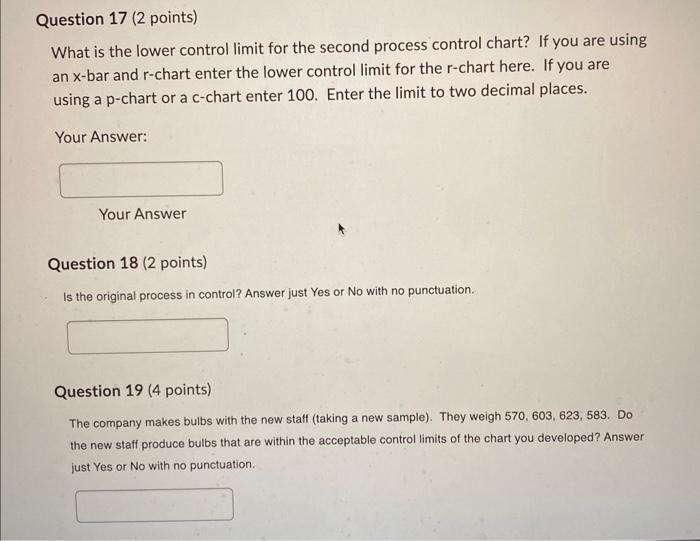
The Watson Electric Company produces LED light bulbs. The following data on the number of lumens for 40-watt bulbs were collected from the process. You are asked to prepare the appropriate 3 sigma control chart to evaluate whether the process is in control. Question 14 (3 points) What is the upper control limit for the process control chart? If you are using an x bar and r-chart enter the upper control limit for the x-bar chart here. If you are using a p-chart or a c-chart enter the upper control limit here. Enter the limit to two decimal places. Your Answer: Your Answer What is the lower control limit for the process control chart? If you are using an x bar and r-chart enter the lower control limit for the x-bar chart here. If you are using a p-chart or a c-chart enter the lower control limit here. Enter the limit to two decimal places. Your Answer: Your Answer Question 16 ( 2 points) What is the upper control limit for the second process control chart? If you are using an x-bar and r-chart enter the upper control limit for the r-chart here. If you are using a p-chart or a c-chart enter 100 . Enter the limit to two decimal places. Your Answer: Your Answer What is the lower control limit for the second process control chart? If you are using an x-bar and r-chart enter the lower control limit for the r-chart here. If you are using a p-chart or a c-chart enter 100. Enter the limit to two decimal places. Your Answer: Your Answer Question 18 ( 2 points) Is the original process in control? Answer just Yes or No with no punctuation. Question 19 (4 points) The company makes bulbs with the new staff (taking a new sample). They weigh 570,603,623,583. Do the new staff produce bulbs that are within the acceptable control limits of the chart you developed? Answer just Yes or No with no punctuation