

Answered step by step
Verified Expert Solution
Question
1 Approved Answer
There are 19 parts to this question. Please read it carefully. Thank You Very Much! Use the data shown in the following table: a. Compute
There are 19 parts to this question. Please read it carefully. Thank You Very Much!
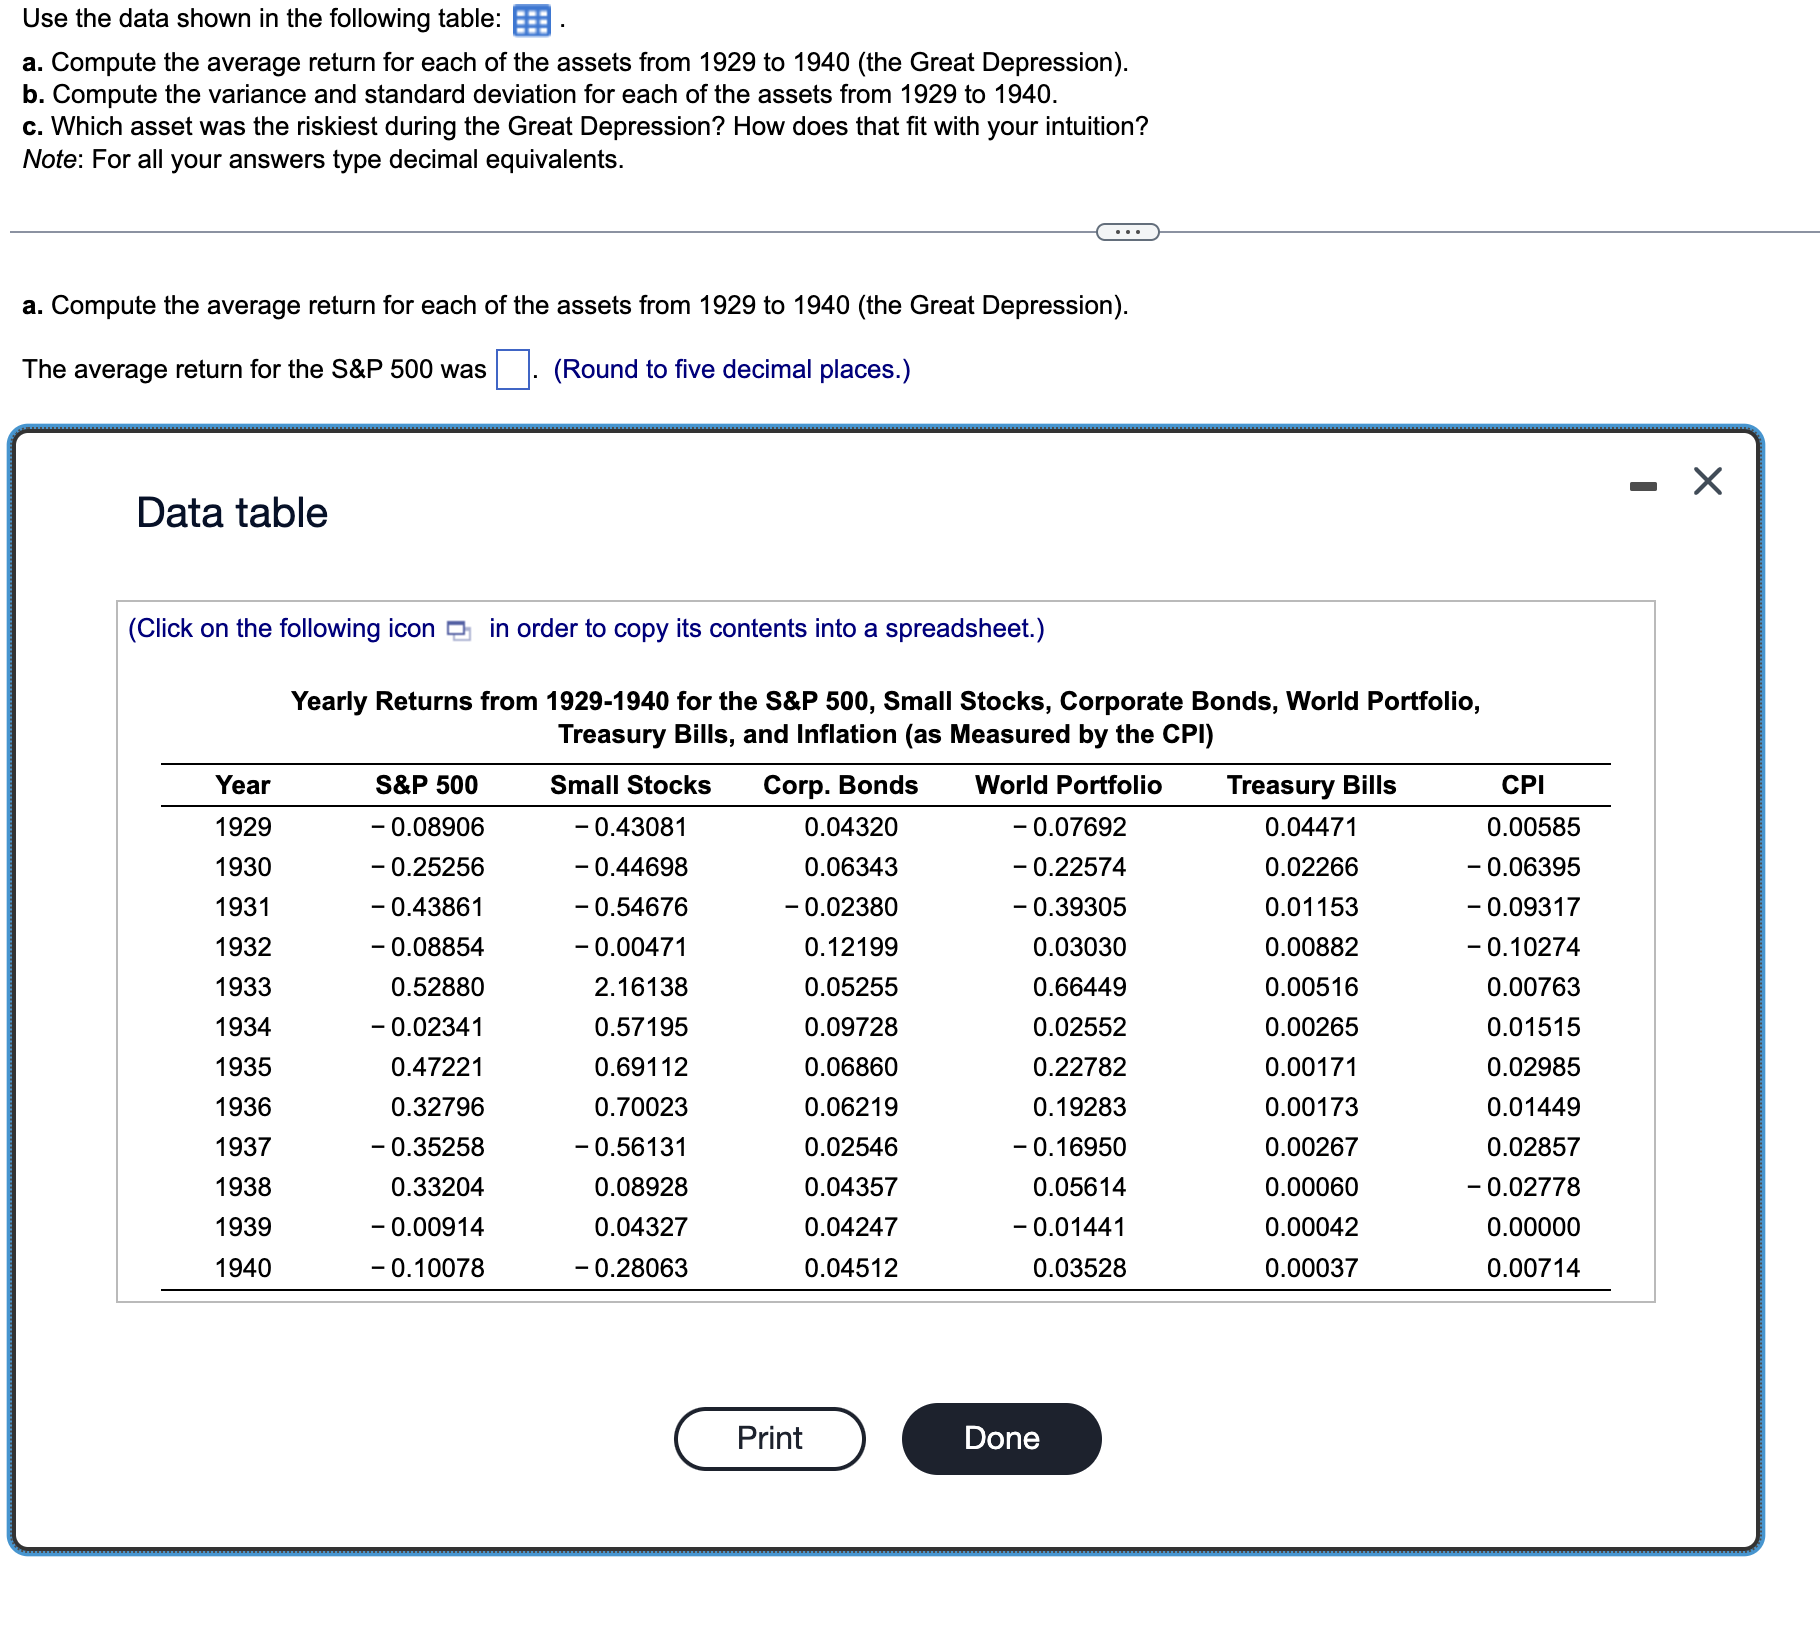 Use the data shown in the following table: a. Compute the average return for each of the assets from 1929 to 1940 (the Great Depression). b. Compute the variance and standard deviation for each of the assets from 1929 to 1940. c. Which asset was the riskiest during the Great Depression? How does that fit with your intuition? Note: For all your answers type decimal equivalents. a. Compute the average return for each of the assets from 1929 to 1940 (the Great Depression). The average return for the S\&P 500 was (Round to five decimal places.) Data table (Click on the following icon in order to copy its contents into a spreadsheet.) Yearly Returns from 1929-1940 for the S\&P 500, Small Stocks, Corporate Bonds, World Portfolio, Treasurv Bills. and Inflation (as Measured bv the CPI)
 Step by Step Solution
There are 3 Steps involved in it
Step: 1

Get Instant Access to Expert-Tailored Solutions
See step-by-step solutions with expert insights and AI powered tools for academic success
Step: 2

Step: 3
Ace Your Homework with AI
Get the answers you need in no time with our AI-driven, step-by-step assistance
Get Started
Finance For Non Financial Managers
Authors: Gene Siciliano
1st Edition
0071413774, 978-0071413770