Answered step by step
Verified Expert Solution
Link Copied!

Question

1 Approved Answer

There are three securities in the market. The following chart shows their possible payoffs: State 1 Probability Return on Return on Return on of Outcome
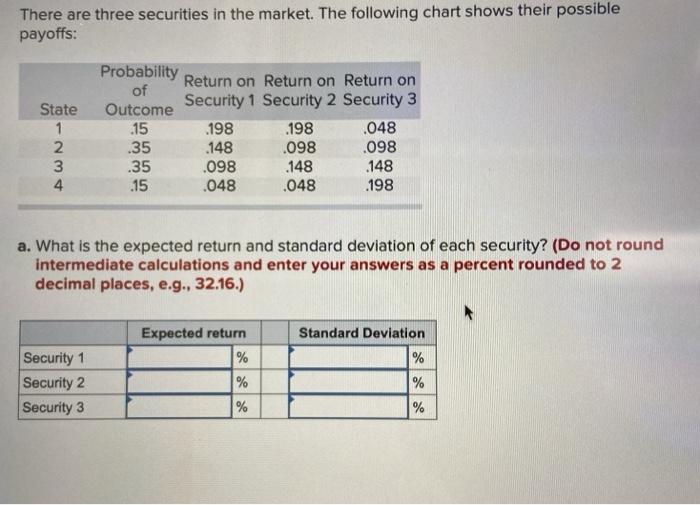
image text in transcribed
There are three securities in the market. The following chart shows their possible payoffs: State 1 Probability Return on Return on Return on of Outcome Security 1 Security 2 Security 3 .15 .198 .198 .048 .35 .148 .098 .098 .35 .098 .148 .148 .15 .048 .048 .198 WN 4 a. What is the expected return and standard deviation of each security? (Do not round intermediate calculations and enter your answers as a percent rounded to 2 decimal places, e.g., 32.16.) Security 1 Security 2 Security 3 Expected return % % Standard Deviation % % %

Step by Step Solution

There are 3 Steps involved in it

Step: 1

blur-text-image

Get Instant Access to Expert-Tailored Solutions

See step-by-step solutions with expert insights and AI powered tools for academic success

Step: 2

blur-text-image

Step: 3

blur-text-image

Ace Your Homework with AI

Get the answers you need in no time with our AI-driven, step-by-step assistance

Get Started

Recommended Textbook for

Cost Benefit Analysis

Authors: Harry F. Campbell, Richard P.C. Brown

3rd Edition

1032320753, 9781032320755

More Books

Students also viewed these Finance questions