

Question
There is a shortage of college basketball and football tickets for some games, and a surplus occurs for other games. The following graph shows the
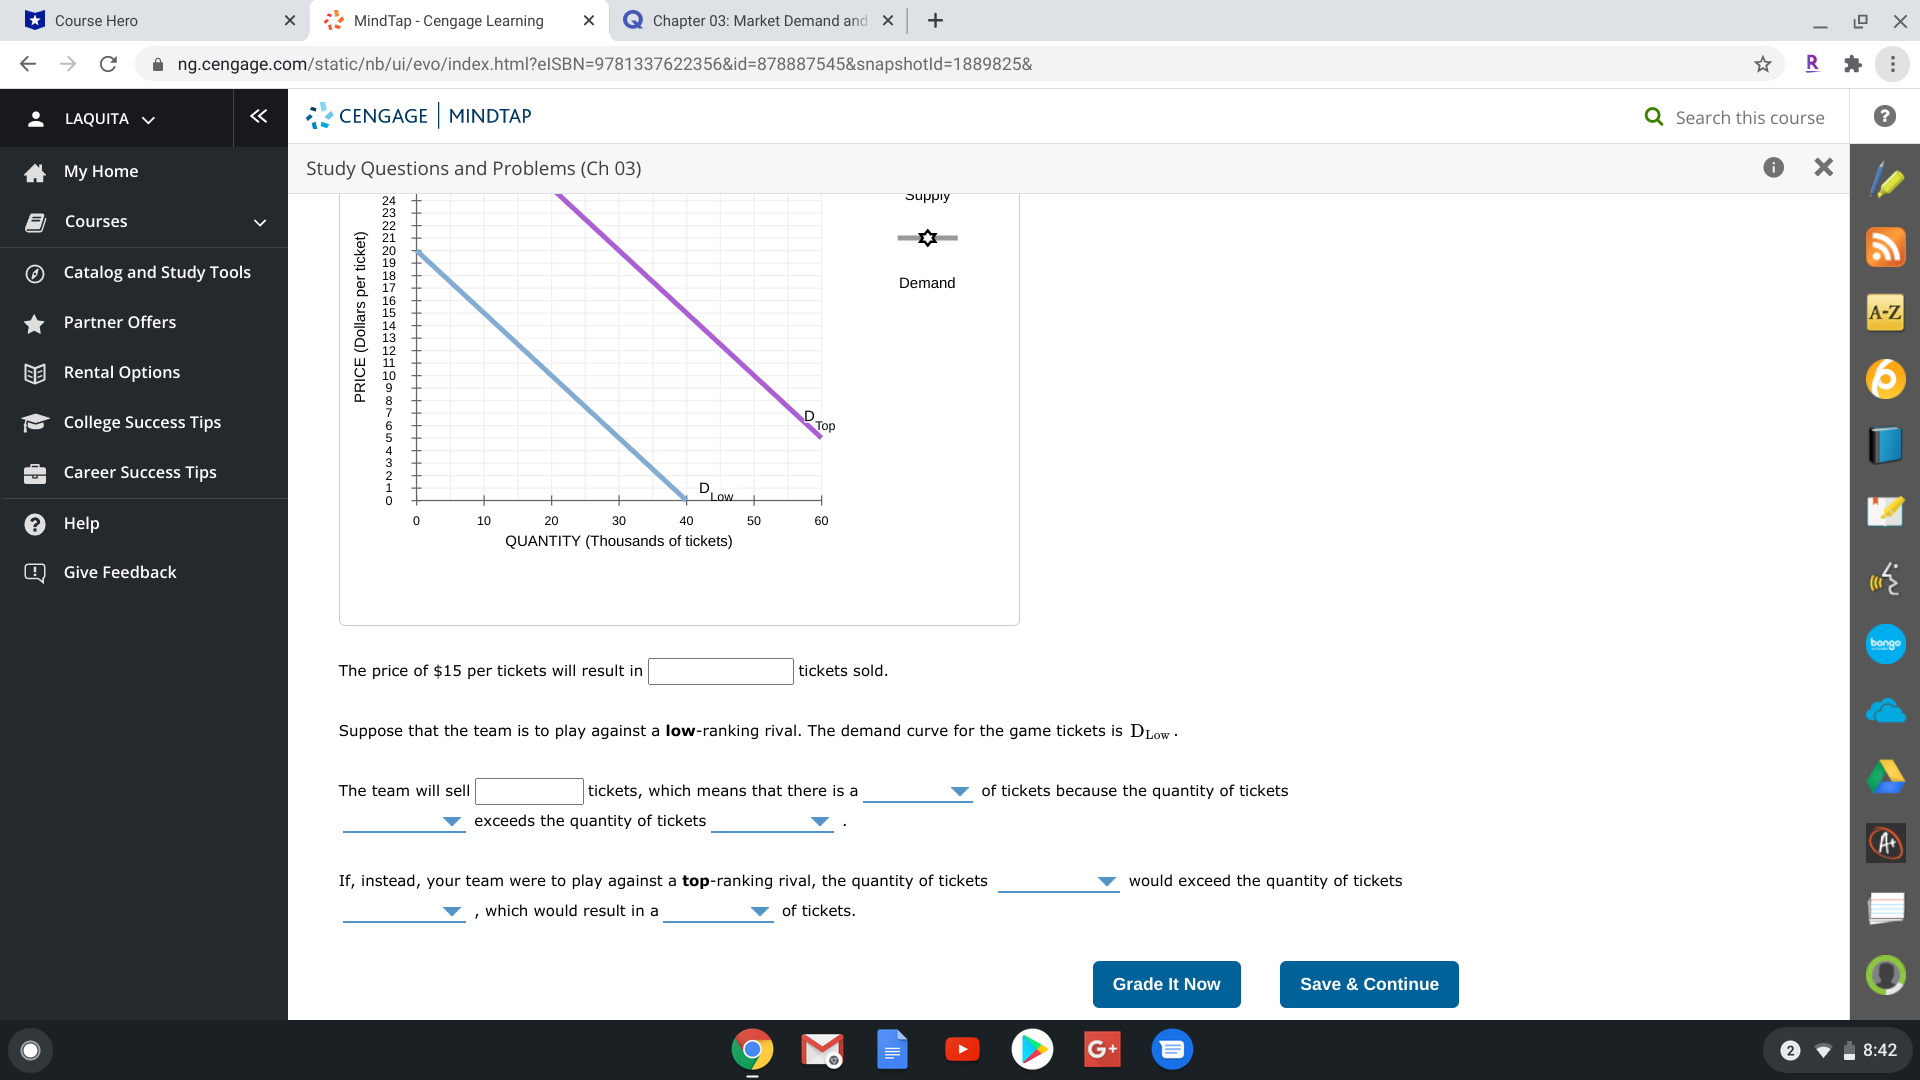
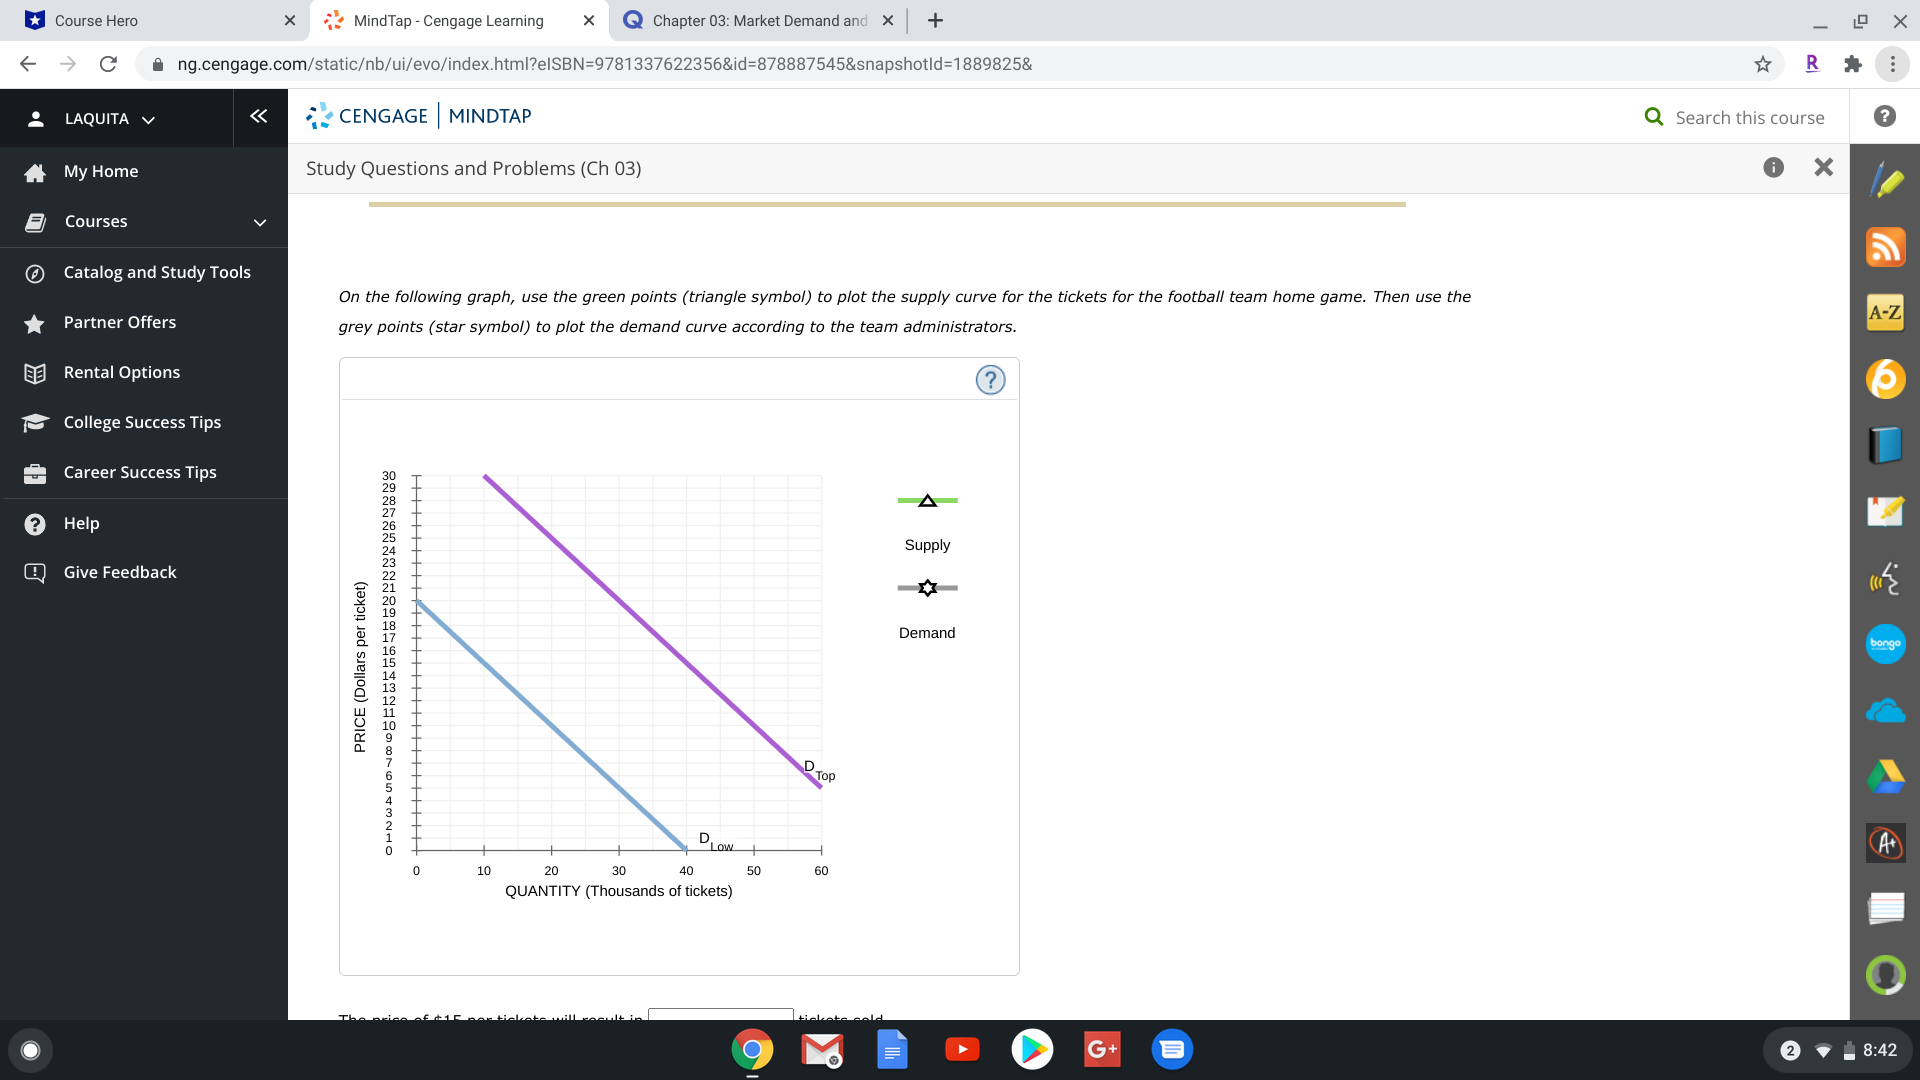
There is a shortage of college basketball and football tickets for some games, and a surplus occurs for other games.
The following graph shows the market for the football team home games. Suppose that your favorite football team has a stadium that seats 15,000 people and that for every game during the season, the football team administrators charge $15 for tickets. The demand curve for the tickets for the top-of-the-league games is labeledD
Top
DTop, and the demand curve for the tickets for the low-ranked games is labeledD
Low
DLow.
Step by Step Solution
There are 3 Steps involved in it
Step: 1

Get Instant Access to Expert-Tailored Solutions
See step-by-step solutions with expert insights and AI powered tools for academic success
Step: 2

Step: 3
Ace Your Homework with AI
Get the answers you need in no time with our AI-driven, step-by-step assistance
Get Started
Economics
Authors: Campbell R. McConnell, Stanley L. Brue, Sean M. Flynn
18th edition
978-0077413798, 0-07-336880-6, 77413792, 978-0-07-33688, 978-0073375694