THERE IS NO FURTHER INFORMATION TO BE PROVIDED
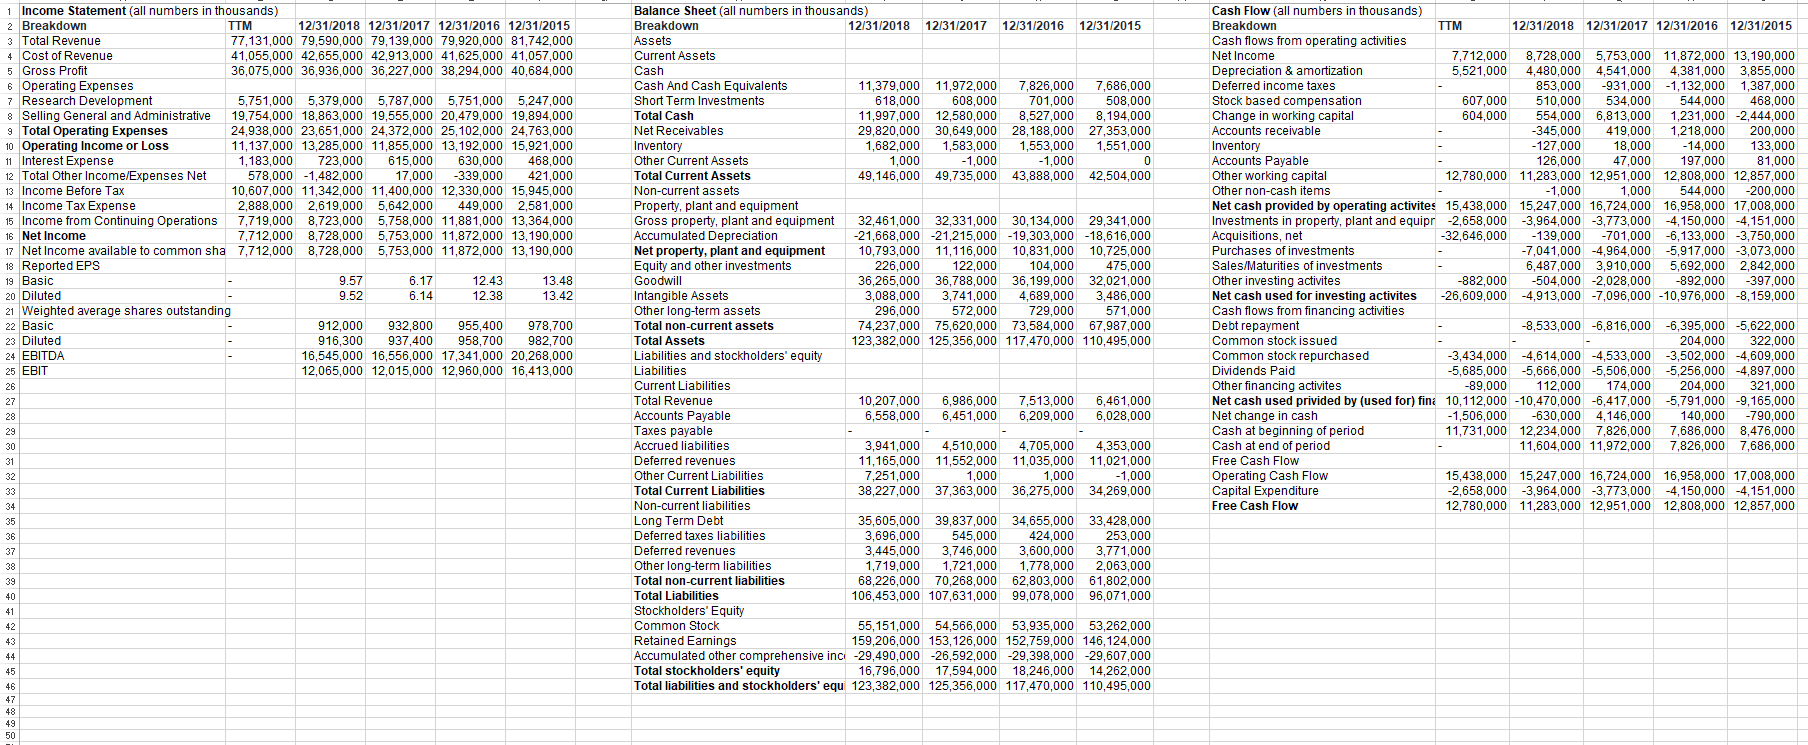
| Income Statement (all numbers in thousands) | | | | | | Balance Sheet (all numbers in thousands) | | | | | Cash Flow (all numbers in thousands) | | | | | |
| Breakdown | TTM | 12/31/2018 | 12/31/2017 | 12/31/2016 | 12/31/2015 | | Breakdown | 12/31/2018 | 12/31/2017 | 12/31/2016 | 12/31/2015 | | Breakdown | TTM | 12/31/2018 | 12/31/2017 | 12/31/2016 | 12/31/2015 |
| Total Revenue | 77,131,000 | 79,590,000 | 79,139,000 | 79,920,000 | 81,742,000 | | Assets | | | | | | Cash flows from operating activities | | | | | |
| Cost of Revenue | 41,055,000 | 42,655,000 | 42,913,000 | 41,625,000 | 41,057,000 | | Current Assets | | | | | | Net Income | 7,712,000 | 8,728,000 | 5,753,000 | 11,872,000 | 13,190,000 |
| Gross Profit | 36,075,000 | 36,936,000 | 36,227,000 | 38,294,000 | 40,684,000 | | Cash | | | | | | Depreciation & amortization | 5,521,000 | 4,480,000 | 4,541,000 | 4,381,000 | 3,855,000 |
| Operating Expenses | | | | | | | Cash And Cash Equivalents | 11,379,000 | 11,972,000 | 7,826,000 | 7,686,000 | | Deferred income taxes | - | 853,000 | -931,000 | -1,132,000 | 1,387,000 |
| Research Development | 5,751,000 | 5,379,000 | 5,787,000 | 5,751,000 | 5,247,000 | | Short Term Investments | 618,000 | 608,000 | 701,000 | 508,000 | | Stock based compensation | 607,000 | 510,000 | 534,000 | 544,000 | 468,000 |
| Selling General and Administrative | 19,754,000 | 18,863,000 | 19,555,000 | 20,479,000 | 19,894,000 | | Total Cash | 11,997,000 | 12,580,000 | 8,527,000 | 8,194,000 | | Change in working capital | 604,000 | 554,000 | 6,813,000 | 1,231,000 | -2,444,000 |
| Total Operating Expenses | 24,938,000 | 23,651,000 | 24,372,000 | 25,102,000 | 24,763,000 | | Net Receivables | 29,820,000 | 30,649,000 | 28,188,000 | 27,353,000 | | Accounts receivable | - | -345,000 | 419,000 | 1,218,000 | 200,000 |
| Operating Income or Loss | 11,137,000 | 13,285,000 | 11,855,000 | 13,192,000 | 15,921,000 | | Inventory | 1,682,000 | 1,583,000 | 1,553,000 | 1,551,000 | | Inventory | - | -127,000 | 18,000 | -14,000 | 133,000 |
| Interest Expense | 1,183,000 | 723,000 | 615,000 | 630,000 | 468,000 | | Other Current Assets | 1,000 | -1,000 | -1,000 | 0 | | Accounts Payable | - | 126,000 | 47,000 | 197,000 | 81,000 |
| Total Other Income/Expenses Net | 578,000 | -1,482,000 | 17,000 | -339,000 | 421,000 | | Total Current Assets | 49,146,000 | 49,735,000 | 43,888,000 | 42,504,000 | | Other working capital | 12,780,000 | 11,283,000 | 12,951,000 | 12,808,000 | 12,857,000 |
| Income Before Tax | 10,607,000 | 11,342,000 | 11,400,000 | 12,330,000 | 15,945,000 | | Non-current assets | | | | | | Other non-cash items | - | -1,000 | 1,000 | 544,000 | -200,000 |
| Income Tax Expense | 2,888,000 | 2,619,000 | 5,642,000 | 449,000 | 2,581,000 | | Property, plant and equipment | | | | | | Net cash provided by operating activites | 15,438,000 | 15,247,000 | 16,724,000 | 16,958,000 | 17,008,000 |
| Income from Continuing Operations | 7,719,000 | 8,723,000 | 5,758,000 | 11,881,000 | 13,364,000 | | Gross property, plant and equipment | 32,461,000 | 32,331,000 | 30,134,000 | 29,341,000 | | Investments in property, plant and equipment | -2,658,000 | -3,964,000 | -3,773,000 | -4,150,000 | -4,151,000 |
| Net Income | 7,712,000 | 8,728,000 | 5,753,000 | 11,872,000 | 13,190,000 | | Accumulated Depreciation | -21,668,000 | -21,215,000 | -19,303,000 | -18,616,000 | | Acquisitions, net | -32,646,000 | -139,000 | -701,000 | -6,133,000 | -3,750,000 |
| Net Income available to common shareholders | 7,712,000 | 8,728,000 | 5,753,000 | 11,872,000 | 13,190,000 | | Net property, plant and equipment | 10,793,000 | 11,116,000 | 10,831,000 | 10,725,000 | | Purchases of investments | - | -7,041,000 | -4,964,000 | -5,917,000 | -3,073,000 |
| Reported EPS | | | | | | | Equity and other investments | 226,000 | 122,000 | 104,000 | 475,000 | | Sales/Maturities of investments | - | 6,487,000 | 3,910,000 | 5,692,000 | 2,842,000 |
| Basic | - | 9.57 | 6.17 | 12.43 | 13.48 | | Goodwill | 36,265,000 | 36,788,000 | 36,199,000 | 32,021,000 | | Other investing activites | -882,000 | -504,000 | -2,028,000 | -892,000 | -397,000 |
| Diluted | - | 9.52 | 6.14 | 12.38 | 13.42 | | Intangible Assets | 3,088,000 | 3,741,000 | 4,689,000 | 3,486,000 | | Net cash used for investing activites | -26,609,000 | -4,913,000 | -7,096,000 | -10,976,000 | -8,159,000 |
| Weighted average shares outstanding | | | | | | | Other long-term assets | 296,000 | 572,000 | 729,000 | 571,000 | | Cash flows from financing activities | | | | | |
| Basic | - | 912,000 | 932,800 | 955,400 | 978,700 | | Total non-current assets | 74,237,000 | 75,620,000 | 73,584,000 | 67,987,000 | | Debt repayment | - | -8,533,000 | -6,816,000 | -6,395,000 | -5,622,000 |
| Diluted | - | 916,300 | 937,400 | 958,700 | 982,700 | | Total Assets | 123,382,000 | 125,356,000 | 117,470,000 | 110,495,000 | | Common stock issued | - | - | - | 204,000 | 322,000 |
| EBITDA | - | 16,545,000 | 16,556,000 | 17,341,000 | 20,268,000 | | Liabilities and stockholders' equity | | | | | | Common stock repurchased | -3,434,000 | -4,614,000 | -4,533,000 | -3,502,000 | -4,609,000 |
| EBIT | | 12,065,000 | 12,015,000 | 12,960,000 | 16,413,000 | | Liabilities | | | | | | Dividends Paid | -5,685,000 | -5,666,000 | -5,506,000 | -5,256,000 | -4,897,000 |
| | | | | | | | Current Liabilities | | | | | | Other financing activites | -89,000 | 112,000 | 174,000 | 204,000 | 321,000 |
| | | | | | | | Total Revenue | 10,207,000 | 6,986,000 | 7,513,000 | 6,461,000 | | Net cash used privided by (used for) financing activities | 10,112,000 | -10,470,000 | -6,417,000 | -5,791,000 | -9,165,000 |
| | | | | | | | Accounts Payable | 6,558,000 | 6,451,000 | 6,209,000 | 6,028,000 | | Net change in cash | -1,506,000 | -630,000 | 4,146,000 | 140,000 | -790,000 |
| | | | | | | | Taxes payable | - | - | - | - | | Cash at beginning of period | 11,731,000 | 12,234,000 | 7,826,000 | 7,686,000 | 8,476,000 |
| | | | | | | | Accrued liabilities | 3,941,000 | 4,510,000 | 4,705,000 | 4,353,000 | | Cash at end of period | - | 11,604,000 | 11,972,000 | 7,826,000 | 7,686,000 |
| | | | | | | | Deferred revenues | 11,165,000 | 11,552,000 | 11,035,000 | 11,021,000 | | Free Cash Flow | | | | | |
| | | | | | | | Other Current Liabilities | 7,251,000 | 1,000 | 1,000 | -1,000 | | Operating Cash Flow | 15,438,000 | 15,247,000 | 16,724,000 | 16,958,000 | 17,008,000 |
| | | | | | | | Total Current Liabilities | 38,227,000 | 37,363,000 | 36,275,000 | 34,269,000 | | Capital Expenditure | -2,658,000 | -3,964,000 | -3,773,000 | -4,150,000 | -4,151,000 |
| | | | | | | | Non-current liabilities | | | | | | Free Cash Flow | 12,780,000 | 11,283,000 | 12,951,000 | 12,808,000 | 12,857,000 |
| | | | | | | | Long Term Debt | 35,605,000 | 39,837,000 | 34,655,000 | 33,428,000 | | | | | | | |
| | | | | | | | Deferred taxes liabilities | 3,696,000 | 545,000 | 424,000 | 253,000 | | | | | | | |
| | | | | | | | Deferred revenues | 3,445,000 | 3,746,000 | 3,600,000 | 3,771,000 | | | | | | | |
| | | | | | | | Other long-term liabilities | 1,719,000 | 1,721,000 | 1,778,000 | 2,063,000 | | | | | | | |
| | | | | | | | Total non-current liabilities | 68,226,000 | 70,268,000 | 62,803,000 | 61,802,000 | | | | | | | |
| | | | | | | | Total Liabilities | 106,453,000 | 107,631,000 | 99,078,000 | 96,071,000 | | | | | | | |
| | | | | | | | Stockholders' Equity | | | | | | | | | | | |
| | | | | | | | Common Stock | 55,151,000 | 54,566,000 | 53,935,000 | 53,262,000 | | | | | | | |
| | | | | | | | Retained Earnings | 159,206,000 | 153,126,000 | 152,759,000 | 146,124,000 | | | | | | | |
| | | | | | | | Accumulated other comprehensive income | -29,490,000 | -26,592,000 | -29,398,000 | -29,607,000 | | | | | | | |
| | | | | | | | Total stockholders' equity | 16,796,000 | 17,594,000 | 18,246,000 | 14,262,000 | | | | | | | |
| | | | | | | | Total liabilities and stockholders' equity | 123,382,000 | 125,356,000 | 117,470,000 | 110,495,000 | | | | | | | |
| | | | | | | | | | | | | | | | | | | |
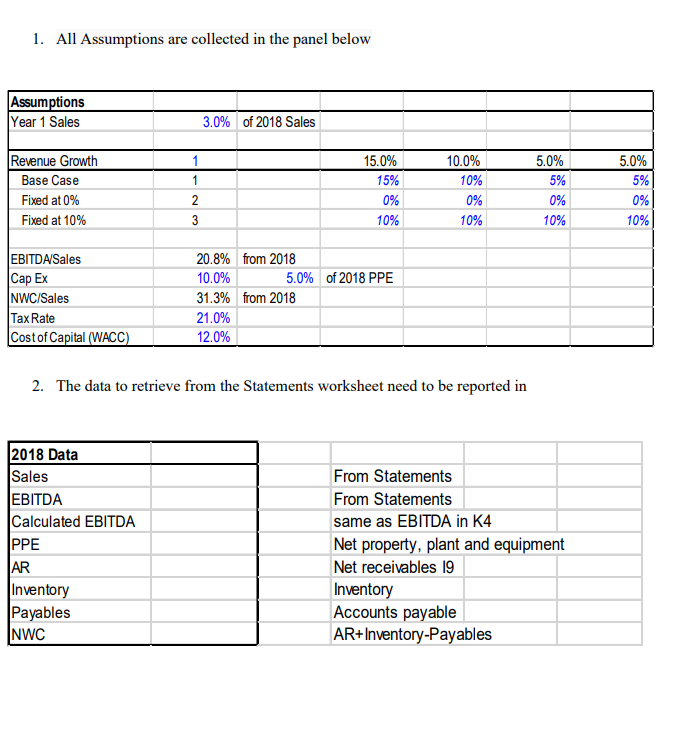
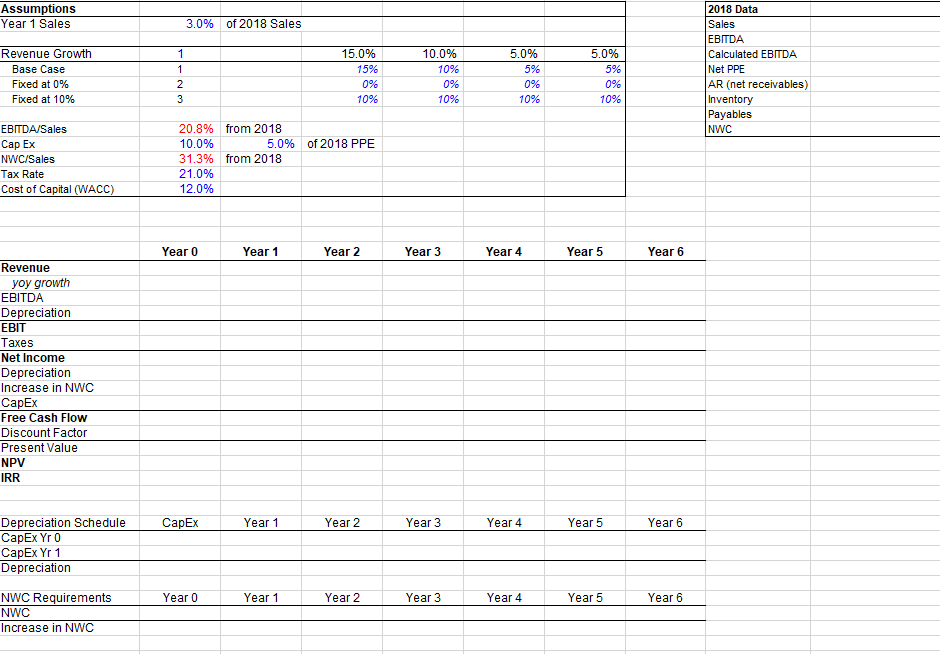
| Assumptions | | | | | | | | 2018 Data | |
| Year 1 Sales | 3.0% | of 2018 Sales | | | | | | Sales | |
| | | | | | | | | EBITDA | |
| Revenue Growth | 1 | | 15.0% | 10.0% | 5.0% | 5.0% | | Calculated EBITDA | |
| Base Case | 1 | | 15% | 10% | 5% | 5% | | Net PPE | |
| Fixed at 0% | 2 | | 0% | 0% | 0% | 0% | | AR (net receivables) | |
| Fixed at 10% | 3 | | 10% | 10% | 10% | 10% | | Inventory | |
| | | | | | | | | Payables | |
| EBITDA/Sales | 20.8% | from 2018 | | | | | | NWC | |
| Cap Ex | 10.0% | 5.0% | of 2018 PPE | | | | | | |
| NWC/Sales | 31.3% | from 2018 | | | | | | | |
| Tax Rate | 21.0% | | | | | | | | |
| Cost of Capital (WACC) | 12.0% | | | | | | | | |
| | | | | | | | | | |
| | | | | | | | | | |
| | | | | | | | | | |
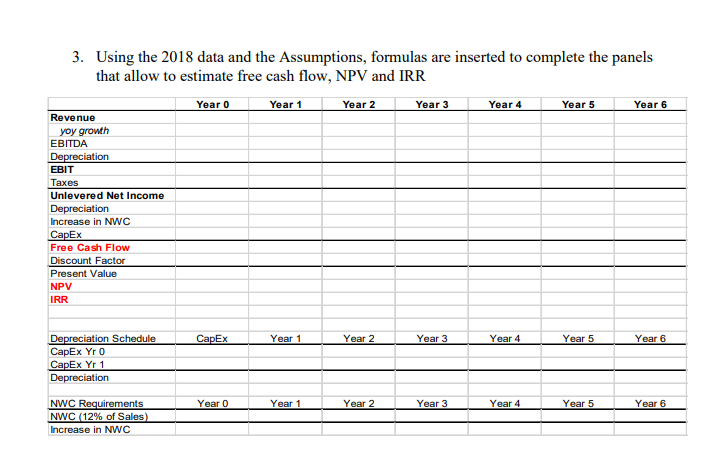
| | Year 0 | Year 1 | Year 2 | Year 3 | Year 4 | Year 5 | Year 6 | | |
| Revenue | | | | | | | | | |
| yoy growth | | | | | | | | | |
| EBITDA | | | | | | | | | |
| Depreciation | | | | | | | | | |
| EBIT | | | | | | | | | |
| Taxes | | | | | | | | | |
| Net Income | | | | | | | | | |
| Depreciation | | | | | | | | | |
| Increase in NWC | | | | | | | | | |
| CapEx | | | | | | | | | |
| Free Cash Flow | | | | | | | | | |
| Discount Factor | | | | | | | | | |
| Present Value | | | | | | | | | |
| NPV | | | | | | | | | |
| IRR | | | | | | | | | |
| | | | | | | | | | |
| | | | | | | | | | |
| Depreciation Schedule | CapEx | Year 1 | Year 2 | Year 3 | Year 4 | Year 5 | Year 6 | | |
| CapEx Yr 0 | | | | | | | | | |
| CapEx Yr 1 | | | | | | | | | |
| Depreciation | | | | | | | | | |
| | | | | | | | | | |
| NWC Requirements | Year 0 | Year 1 | Year 2 | Year 3 | Year 4 | Year 5 | Year 6 | | |
| NWC | | | | | | | | | |
| Increase in NWC | | | | | | | | | |
| | | | | | | | | | |
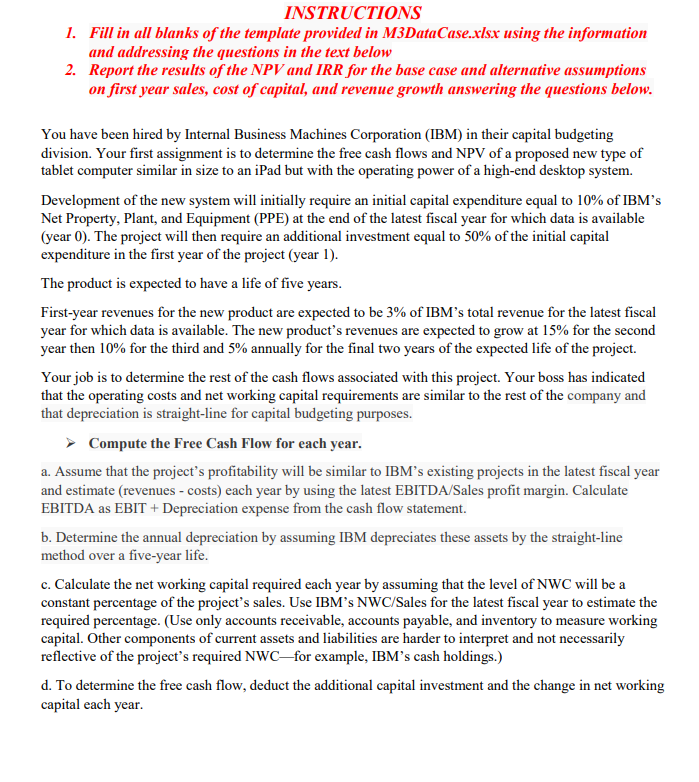
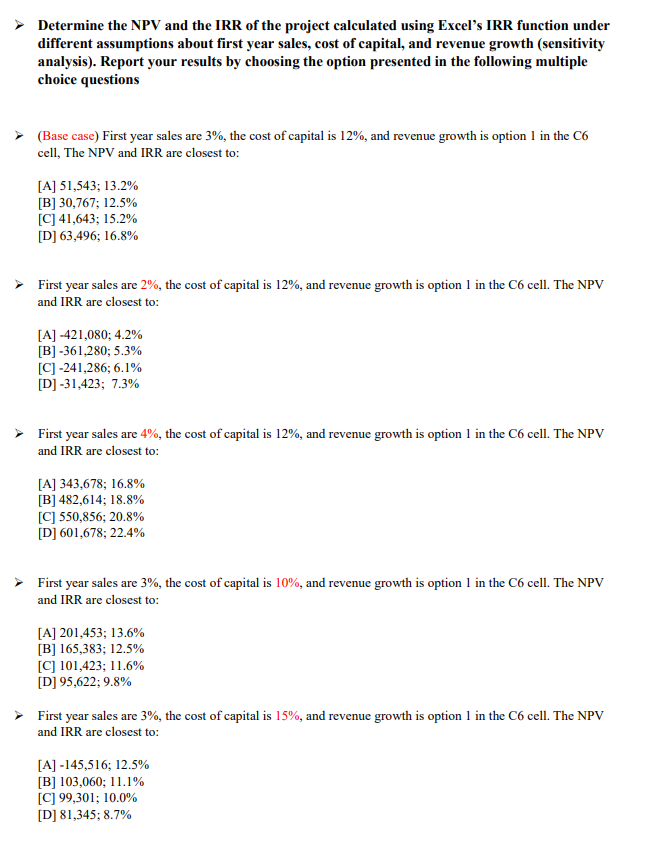
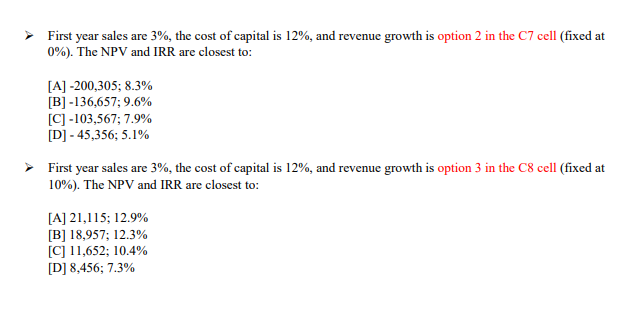
INSTRUCTIONS 1. Fill in all blanks of the template provided in M3DataCase.xlsx using the information and addressing the questions in the text below 2. Report the results of the NPV and IRR for the base case and alternative assumptions on first year sales, cost of capital, and revenue growth answering the questions below. You have been hired by Internal Business Machines Corporation (IBM) in their capital budgeting division. Your first assignment is to determine the free cash flows and NPV of a proposed new type of tablet computer similar in size to an iPad but with the operating power of a high-end desktop system. Development of the new system will initially require an initial capital expenditure equal to 10% of IBM's Net Property, Plant, and Equipment (PPE) at the end of the latest fiscal year for which data is available (year 0 ). The project will then require an additional investment equal to 50% of the initial capital expenditure in the first year of the project (year 1). The product is expected to have a life of five years. First-year revenues for the new product are expected to be 3\% of IBM's total revenue for the latest fiscal year for which data is available. The new product's revenues are expected to grow at 15% for the second year then 10% for the third and 5% annually for the final two years of the expected life of the project. Your job is to determine the rest of the cash flows associated with this project. Your boss has indicated that the operating costs and net working capital requirements are similar to the rest of the company and that depreciation is straight-line for capital budgeting purposes. Compute the Free Cash Flow for each year. a. Assume that the project's profitability will be similar to IBM's existing projects in the latest fiscal year and estimate (revenues - costs) each year by using the latest EBITDA/Sales profit margin. Calculate EBITDA as EBIT + Depreciation expense from the cash flow statement. b. Determine the annual depreciation by assuming IBM depreciates these assets by the straight-line method over a five-year life. c. Calculate the net working capital required each year by assuming that the level of NWC will be a constant percentage of the project's sales. Use IBM's NWC/Sales for the latest fiscal year to estimate the required percentage. (Use only accounts receivable, accounts payable, and inventory to measure working capital. Other components of current assets and liabilities are harder to interpret and not necessarily reflective of the project's required NWC -for example, IBM's cash holdings.) d. To determine the free cash flow, deduct the additional capital investment and the change in net working capital each year. Determine the NPV and the IRR of the project calculated using Excel's IRR function under different assumptions about first year sales, cost of capital, and revenue growth (sensitivity analysis). Report your results by choosing the option presented in the following multiple choice questions (Base case) First year sales are 3\%, the cost of capital is 12%, and revenue growth is option 1 in the C6 cell, The NPV and IRR are closest to: [A] 51,543;13.2% [B] 30,767;12.5% [C] 41,643;15.2% [D] 63,496;16.8% First year sales are 2%, the cost of capital is 12%, and revenue growth is option 1 in the C6 cell. The NPV and IRR are closest to: [A] 421,080;4.2% [B] 361,280;5.3% [C] 241,286;6.1% [D] 31,423;7.3% First year sales are 4%, the cost of capital is 12%, and revenue growth is option 1 in the C6 cell. The NPV and IRR are closest to: [A] 343,678;16.8% [B] 482,614;18.8% [C] 550,856;20.8% [D] 601,678;22.4% First year sales are 3%, the cost of capital is 10%, and revenue growth is option 1 in the C6 cell. The NPV and IRR are closest to: [A] 201,453;13.6% [B] 165,383;12.5% [C] 101,423;11.6% [D] 95,622;9.8% First year sales are 3%, the cost of capital is 15%, and revenue growth is option 1 in the C6 cell. The NPV and IRR are closest to: [A] -145,516; 12.5\% [B] 103,060;11.1% [C] 99,301;10.0% [D] 81,345;8.7% First year sales are 3%, the cost of capital is 12%, and revenue growth is option 2 in the C7 cell (fixed at 0%). The NPV and IRR are closest to: [A] 200,305;8.3% [B] 136,657;9.6% [C]103,567;7.9% [D] 45,356;5.1% First year sales are 3%, the cost of capital is 12%, and revenue growth is option 3 in the C8 cell (fixed at 10%). The NPV and IRR are closest to: [A] 21,115;12.9% [B] 18,957;12.3% [C] 11,652;10.4% [D] 8,456;7.3% 1. All Assumptions are collected in the panel below 2. The data to retrieve from the Statements worksheet need to be reported in 3. Using the 2018 data and the Assumptions, formulas are inserted to complete the panels that allow to estimate free cash flow, NPV and IRR INSTRUCTIONS 1. Fill in all blanks of the template provided in M3DataCase.xlsx using the information and addressing the questions in the text below 2. Report the results of the NPV and IRR for the base case and alternative assumptions on first year sales, cost of capital, and revenue growth answering the questions below. You have been hired by Internal Business Machines Corporation (IBM) in their capital budgeting division. Your first assignment is to determine the free cash flows and NPV of a proposed new type of tablet computer similar in size to an iPad but with the operating power of a high-end desktop system. Development of the new system will initially require an initial capital expenditure equal to 10% of IBM's Net Property, Plant, and Equipment (PPE) at the end of the latest fiscal year for which data is available (year 0 ). The project will then require an additional investment equal to 50% of the initial capital expenditure in the first year of the project (year 1). The product is expected to have a life of five years. First-year revenues for the new product are expected to be 3\% of IBM's total revenue for the latest fiscal year for which data is available. The new product's revenues are expected to grow at 15% for the second year then 10% for the third and 5% annually for the final two years of the expected life of the project. Your job is to determine the rest of the cash flows associated with this project. Your boss has indicated that the operating costs and net working capital requirements are similar to the rest of the company and that depreciation is straight-line for capital budgeting purposes. Compute the Free Cash Flow for each year. a. Assume that the project's profitability will be similar to IBM's existing projects in the latest fiscal year and estimate (revenues - costs) each year by using the latest EBITDA/Sales profit margin. Calculate EBITDA as EBIT + Depreciation expense from the cash flow statement. b. Determine the annual depreciation by assuming IBM depreciates these assets by the straight-line method over a five-year life. c. Calculate the net working capital required each year by assuming that the level of NWC will be a constant percentage of the project's sales. Use IBM's NWC/Sales for the latest fiscal year to estimate the required percentage. (Use only accounts receivable, accounts payable, and inventory to measure working capital. Other components of current assets and liabilities are harder to interpret and not necessarily reflective of the project's required NWC -for example, IBM's cash holdings.) d. To determine the free cash flow, deduct the additional capital investment and the change in net working capital each year. Determine the NPV and the IRR of the project calculated using Excel's IRR function under different assumptions about first year sales, cost of capital, and revenue growth (sensitivity analysis). Report your results by choosing the option presented in the following multiple choice questions (Base case) First year sales are 3\%, the cost of capital is 12%, and revenue growth is option 1 in the C6 cell, The NPV and IRR are closest to: [A] 51,543;13.2% [B] 30,767;12.5% [C] 41,643;15.2% [D] 63,496;16.8% First year sales are 2%, the cost of capital is 12%, and revenue growth is option 1 in the C6 cell. The NPV and IRR are closest to: [A] 421,080;4.2% [B] 361,280;5.3% [C] 241,286;6.1% [D] 31,423;7.3% First year sales are 4%, the cost of capital is 12%, and revenue growth is option 1 in the C6 cell. The NPV and IRR are closest to: [A] 343,678;16.8% [B] 482,614;18.8% [C] 550,856;20.8% [D] 601,678;22.4% First year sales are 3%, the cost of capital is 10%, and revenue growth is option 1 in the C6 cell. The NPV and IRR are closest to: [A] 201,453;13.6% [B] 165,383;12.5% [C] 101,423;11.6% [D] 95,622;9.8% First year sales are 3%, the cost of capital is 15%, and revenue growth is option 1 in the C6 cell. The NPV and IRR are closest to: [A] -145,516; 12.5\% [B] 103,060;11.1% [C] 99,301;10.0% [D] 81,345;8.7% First year sales are 3%, the cost of capital is 12%, and revenue growth is option 2 in the C7 cell (fixed at 0%). The NPV and IRR are closest to: [A] 200,305;8.3% [B] 136,657;9.6% [C]103,567;7.9% [D] 45,356;5.1% First year sales are 3%, the cost of capital is 12%, and revenue growth is option 3 in the C8 cell (fixed at 10%). The NPV and IRR are closest to: [A] 21,115;12.9% [B] 18,957;12.3% [C] 11,652;10.4% [D] 8,456;7.3% 1. All Assumptions are collected in the panel below 2. The data to retrieve from the Statements worksheet need to be reported in 3. Using the 2018 data and the Assumptions, formulas are inserted to complete the panels that allow to estimate free cash flow, NPV and IRR