Answered step by step
Verified Expert Solution
Question
1 Approved Answer
these are questions related to data structure. This is a question related to Computer Networking. 1. (16 Marks) For this exercise, choose a network with


these are questions related to data structure.
This is a question related to Computer Networking.
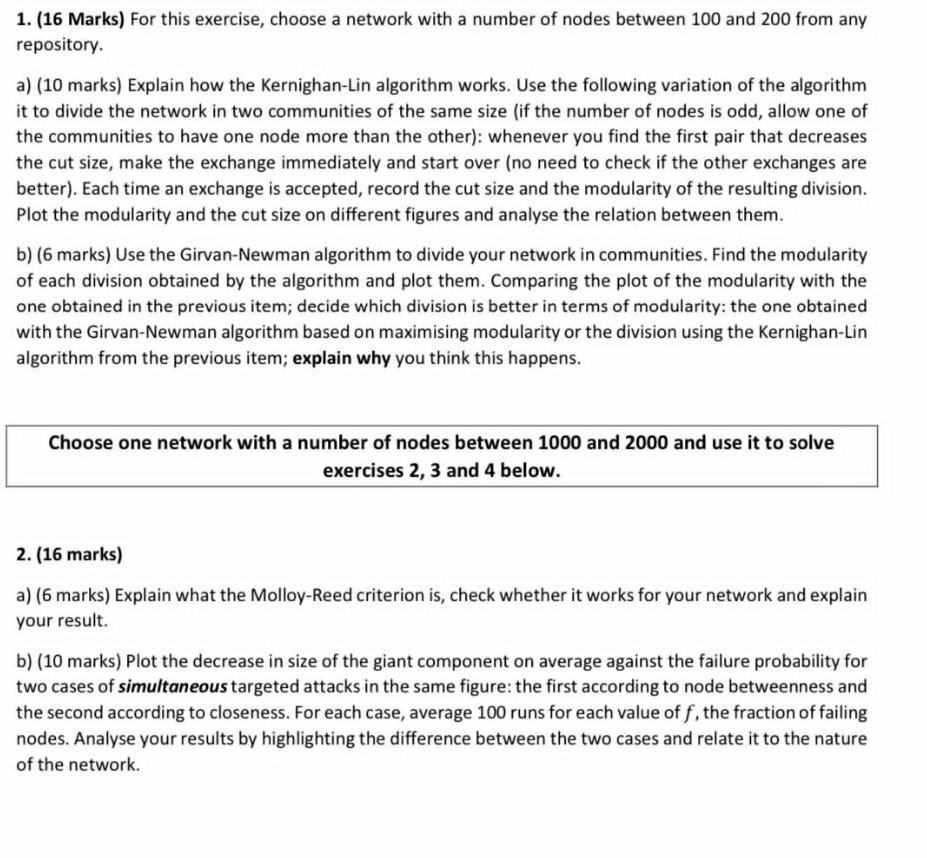
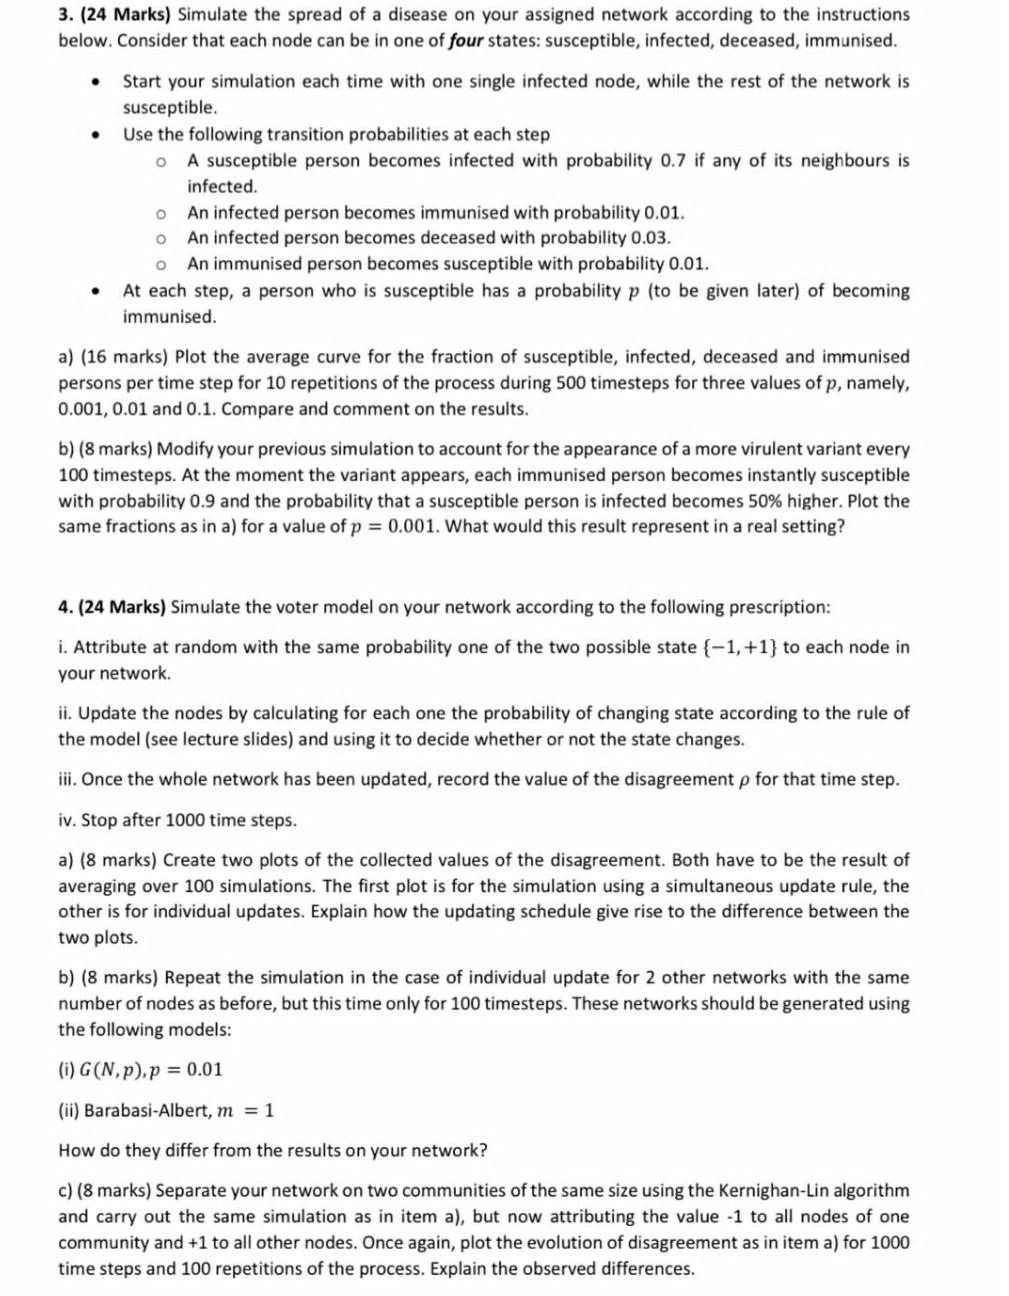
1. (16 Marks) For this exercise, choose a network with a number of nodes between 100 and 200 from any repository. a) (10 marks) Explain how the Kernighan-Lin algorithm works. Use the following variation of the algorithm it to divide the network in two communities of the same size (if the number of nodes is odd, allow one of the communities to have one node more than the other): whenever you find the first pair that decreases the cut size, make the exchange immediately and start over (no need to check if the other exchanges are better). Each time an exchange is accepted, record the cut size and the modularity of the resulting division. Plot the modularity and the cut size on different figures and analyse the relation between them. b) (6 marks) Use the Girvan-Newman algorithm to divide your network in communities. Find the modularity of each division obtained by the algorithm and plot them. Comparing the plot of the modularity with the one obtained in the previous item; decide which division is better in terms of modularity: the one obtained with the Girvan-Newman algorithm based on maximising modularity or the division using the Kernighan-Lin algorithm from the previous item; explain why you think this happens. Choose one network with a number of nodes between 1000 and 2000 and use it to solve exercises 2, 3 and 4 below. 2. (16 marks) a) (6 marks) Explain what the Molloy-Reed criterion is, check whether it works for your network and explain your result. b) (10 marks) Plot the decrease in size of the giant component on average against the failure probability for two cases of simultaneous targeted attacks in the same figure: the first according to node betweenness and the second according to closeness. For each case, average 100 runs for each value of f, the fraction of failing nodes. Analyse your results by highlighting the difference between the two cases and relate it to the nature of the network. 3. (24 Marks) Simulate the spread of a disease on your assigned network according to the instructions below. Consider that each node can be in one of four states: susceptible, infected, deceased, immunised. Start your simulation each time with one single infected node, while the rest of the network is susceptible. Use the following transition probabilities at each step 0 A susceptible person becomes infected with probability 0.7 if any of its neighbours is infected. An infected person becomes immunised with probability 0.01. An infected person becomes deceased with probability 0.03. An immunised person becomes susceptible with probability 0.01. At each step, a person who is susceptible has a probability p (to be given later) of becoming immunised. o o . a) (16 marks) Plot the average curve for the fraction of susceptible, infected, deceased and immunised persons per time step for 10 repetitions of the process during 500 timesteps for three values of p, namely, 0.001, 0.01 and 0.1. Compare and comment on the results. b) (8 marks) Modify your previous simulation to account for the appearance of a more virulent variant every 100 timesteps. At the moment the variant appears, each immunised person becomes instantly susceptible with probability 0.9 and the probability that a susceptible person is infected becomes 50% higher. Plot the same fractions as in a) for a value of p = 0.001. What would this result represent in a real setting? 4. (24 Marks) Simulate the voter model on your network according to the following prescription: i. Attribute at random with the same probability one of the two possible state {-1, +1} to each node in your network. ii. Update the nodes by calculating for each one the probability of changing state according to the rule of the model (see lecture slides) and using it to decide whether or not the state changes. ili. Once the whole network has been updated, record the value of the disagreement p for that time step. iv. Stop after 1000 time steps. a) (8 marks) Create two plots of the collected values of the disagreement. Both have to be the result of averaging over 100 simulations. The first plot is for the simulation using a simultaneous update rule, the other is for individual updates. Explain how the updating schedule give rise to the difference between the two plots. b) (8 marks) Repeat the simulation in the case of individual update for 2 other networks with the same number of nodes as before, but this time only for 100 timesteps. These networks should be generated using the following models: (i) G(N,p).p = 0.01 (ii) Barabasi-Albert, m = 1 How do they differ from the results on your network? c) (8 marks) Separate your network on two communities of the same size using the Kernighan-Lin algorithm and carry out the same simulation as in item a), but now attributing the value -1 to all nodes of one community and +1 to all other nodes. Once again, plot the evolution of disagreement as in item a) for 1000 time steps and 100 repetitions of the process. Explain the observed differencesStep by Step Solution
There are 3 Steps involved in it
Step: 1

Get Instant Access to Expert-Tailored Solutions
See step-by-step solutions with expert insights and AI powered tools for academic success
Step: 2

Step: 3

Ace Your Homework with AI
Get the answers you need in no time with our AI-driven, step-by-step assistance
Get Started


